

Viral Hepatitis Site Metrics
 ShareCompartir
http://www.cdc.gov/hepatitis/
Range: Jan 2010 - Dec 2010
Source: Omniture SiteCatalyst
Overview
- 2,779,532 page views to the site
- Visitors spent an average of 4.7 minutes on the site
- 64% of the traffic was from external sources (outside of CDC.gov including bookmarked, typed or saved URLs) while 36% was from within CDC.gov
Most Popular Pages
| Rank | Page Title | Page Views |
|---|---|---|
| 1 | CDC DVH - Division of Viral Hepatitis Home Page | 781,565 |
| 2 | CDC DVH - Hepatitis C Information For the Health Professional | 205,075 |
| 3 | CDC DVH - Hepatitis B Information For the Health Professional | 187,221 |
| 4 | CDC DVH - Hepatitis A Information For the Health Professional | 128,274 |
| 5 | CDC DVH - HBV FAQs for Health Professionals | 107,225 |
| 6 | CDC DVH - HCV FAQs for Health Professionals | 83,470 |
| 7 | CDC DVH - Hepatitis B Information For the Public | 68,927 |
| 8 | CDC DVH - Hepatitis C Information For the Public | 68,547 |
| 9 | CDC DVH - Hepatitis B FAQs for the Public | 67,470 |
| 10 | CDC DVH - Hepatitis C FAQs for the Public | 65,217 |
Top Downloads
| Download Title | Page Views |
|---|---|
| The ABCs of Hepatitis | 18,317 |
| The ABC's of Hepatitis (grayscale version) | 13,275 |
| Hepatitis C Virus (HCV) Infection Testing for Diagnosis | 11,974 |
| Reference for Interpretation of Hepatitis C Virus (HCV) Test Results | 8,876 |
| Interpretation of Hepatitis B Serologic Test Results | 8,677 |
| Hepatitis C General Information | 6,601 |
| Hepatitis B General Information (grayscale version) | 6,244 |
| Reported Cases of Acute Viral Hepatitis, by Type and Year, United States, 1966-2003 | 5,328 |
| Disease Burden from Viral Hepatitis A, B, and C in the United States | 5,293 |
| Hepatitis B General Information | 5,117 |
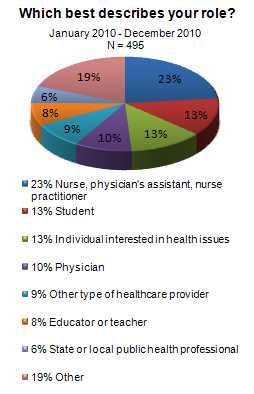
Respondent Profile Summary
Age:
- 50-64 (43%)
- 35-49 (27%)
- 20-34 (23%)
Gender:
- Male (30%)
- Female (70%)
Education:
- College degree (39%)
- Advanced degree (39%)
- Some college (15%)
Frequency of visits :
- Couple of times a year (29%)
- Monthly (22%)
- Weekly (20%)
- First time (19%)
Reason for visit:
- Health information for work (48%)
- Other – generally school related (15%)
- Health information for myself (14%)
- Health information for someone else (loved one, friend, family) (12%)
- Health information for patient or client (12%)
Type of information they were looking for:
- Diseases and conditions (33%)
- Data and statistics (13%)
- Professional training/education materials (11%)
How they found site:
- Search engine (47%)
- Other – CDC awareness (16%)
- Bookmark (12%)
- Referral links from other sites (11%)
Activities after using site:
- Additional research online (42%)
- Print and share (41%)
- Talk to friend or family about topic (30%)
- Bookmark (27%)
Behavioral changes based on experience with site:
- “Likely” or “Very Likely” to do something different to improve their health based on their experience with the site (67%)
Most common changes:
- Be more aware, cautious (34%)
- Change diet, eating or exercise (19%)
- Get vaccinated/take medications (16%)
Social media activities in last 3 months:
- Receive text messages via mobile phone (47%)
- Send text messages via mobile phone (46%)
- Watch videos on a website (44%)
- Participate in online social network (41%)
- Sign up to receive emails from a website (34%)
- Browse through photo galleries (30%)
Viewed CDC website on mobile phone:
- Yes (7%)
- No (93%)

- Page last reviewed: April 19, 2011
- Page last updated: March 25, 2014
- Content source: