

HIV/AIDS Site Metrics
 ShareCompartir
https://www.cdc.gov/hiv/
Range: Jan 2010 - Dec 2010
Source: Omniture SiteCatalyst
Overview
- 8,491,866 page views to the site
- Visitors spent an average of 5.1 minutes on the site
- 76% of the traffic was from external sources (outside of CDC.gov including bookmarked, typed or saved URLs) while 24% was from within CDC.gov
Most Popular Pages
| Rank | Page Title | Page Views |
|---|---|---|
| 1 | CDC HIV/AIDS | 857,291 |
| 2 | CDC - Divisions of HIV/AIDS Prevention | 579,640 |
| 3 | Factsheets | CDC HIV/AIDS | 433,934 |
| 4 | Basic Statistics | Statistics and Surveillance | Topics | CDC HIV/AIDS | 416,411 |
| 5 | HIV Transmission | Questions and Answers | CDC HIV/AIDS | 283,049 |
| 6 | Basic Information about HIV and AIDS | Topics | CDC HIV/AIDS | 243,925 |
| 7 | Questions and Answers | CDC HIV/AIDS | 170,683 |
| 8 | HIV/AIDS Statistics and Surveillance | Topics | CDC HIV/AIDS | 165,702 |
| 9 | HIV and Its Transmission | Factsheets | CDC HIV/AIDS | 112,545 |
| 10 | HIV/AIDS Basics | Questions and Answers | CDC HIV/AIDS | 101,236 |
Top Downloads
| Download Title | Page Views |
|---|---|
| HIV in the United States | 12,839 |
| A Rapid Review of Rapid HIV Antibody Tests | 10,034 |
| HIV/AIDS Surveillance Report | 6,550 |
| HIV/AIDS among African Americans | 5,120 |
| A Review of the CDC's Response to the HIV/AIDS Crisis Among Blacks in the United States, 1981–2009 | 4,956 |
| HIV/AIDS among Youth | 4,914 |
| HIV/AIDS among African Americans | 4,787 |
| Epidemiology of HIV Infection | 3,763 |
| HIV and AIDS: Are You at Risk? | 3,694 |
| HIV Transmission Rates in the United States | 3,410 |
Respondent Profile Summary
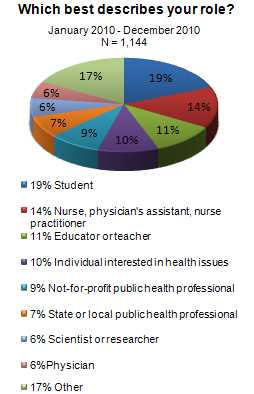
Age:
- 35-49 (32%)
- 50-64 (30%)
- 20-34 (30%)
Gender:
- Male (29%)
- Female (68%)
Education:
- Advanced degree (44%)
- College degree (36%)
- Some college (14%)
Frequency of visits:
- Monthly (29%)
- Couple of times a year (24%)
- Weekly (23%)
- First time (16%)
Reason for visit:
- Health information for work (54%)
- Other – generally school related (27%)
Type of information they were looking for:
- Data and statistics (38%)
- Sexually transmitted diseases (14%)
- Diseases and conditions (9%)
- Disease prevention (9%)
- Professional training/education materials (7%)
- Other – generally HIV/AIDS info (7%)
How they found site:
- Search engine (46%)
- Other – CDC awareness, school (16%)
- Word of mouth (11%)
- Bookmark (11%)
Activities after using site:
- Additional research online (49%)
- Print and share (42%)
- Talk to friend or family about topic (31%)
Behavioral changes based on experience with site:
- “Likely” or “Very Likely” to do something different to improve their health based on their experience with the site (58%)
Most common changes:
- Be more aware, cautious (36%)
- Reduce risky behavior (19%)
- Change diet, eating or exercise (18%)
- Get tested (8%)
Social media activities in last 3 months:
- Receive text messages via mobile phone (56%)
- Send text messages via mobile phone (56%)
- Watch videos on a website (52%)
- Participate in online social network (50%)
- Sign up to receive emails from a website (38%)
- Browse through photo galleries (36%)
- Use personalized web pages (35%)
- Browse websites on phone/mobile device (34%)
- Read blogs or Wikis (30%)
Viewed CDC website on mobile phone:
- Yes (8%)
- No (92%)

- Page last reviewed: April 19, 2011
- Page last updated: June 4, 2013
- Content source: