

NCHHSTP Cross-cutting Site Metrics (Fiscal Year 2014)
 ShareCompartir
On This Page
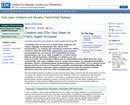
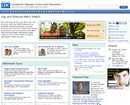
Condom Effectiveness
- 457,994 page views to the site, a decrease of 10% from 2013
- Visitors spent an average of 4.5 minutes on the site
- External sources* accounted for 88% of the traffic to the site while 12% of the traffic came from visitors that were already visiting CDC.gov and made their way to the Condom Effectiveness site
*(outside of CDC.gov including bookmarked, typed or saved URLs)
Condom Effectiveness
Source: Adobe SiteCatalyst
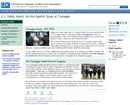
U.S. Public Health Service Syphilis Study at Tuskegee
- 230,891 page views to the site, an increase of 42% from 2013
- Visitors spent an average of 8.3 minutes on the site
- External sources* accounted for 92% of the traffic to the site while 8% of the traffic came from visitors that were already visiting CDC.gov and made their way to the U.S. Public Health Service Syphilis Study at Tuskegee site
*(outside of CDC.gov including bookmarked, typed or saved URLs)
Public Health Service Syphilis Study at Tuskegee
Source: Adobe SiteCatalyst
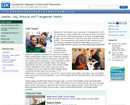
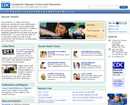
Lesbian, Gay, Bisexual and Transgender Health
- 215,273 page views to the site, an increase of 39% from 2013
- Visitors spent an average of 2.4 minutes on the site
- External sources* accounted for 57% of the traffic to the site while 43% of the traffic came from visitors that were already visiting CDC.gov and made their way to the Lesbian, Gay, Bisexual and Transgender Health site
*(outside of CDC.gov including bookmarked, typed or saved URLs)
Lesbian, Gay, Bisexual and Transgender Health
Source: Adobe SiteCatalyst
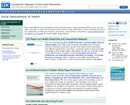
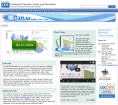
Social Determinants of Health
The NCHHSTP Social Determinants site moved from /socialdeterminants/ to /nchhstp/socialdeterminants/ in July 2015.
- 203,717 page views to the site, an increase of 46% from 2013
- Visitors spent an average of 5.9 minutes on the site
- External sources* accounted for 82% of the traffic to the site while 18% of the traffic came from visitors that were already visiting CDC.gov and made their way to the Social Determinants of Health site
*(outside of CDC.gov including bookmarked, typed or saved URLs)
Social Determinants of Health
Source: Adobe SiteCatalyst
Gay and Bisexual Men's Health (MSM)
- 164,119 page views to the site, an increase of 27% from 2013
- Visitors spent an average of 1.9 minutes on the site
- External sources* accounted for 47% of the traffic to the site while 53% of the traffic came from visitors that were already visiting CDC.gov and made their way to the Gay and Bisexual Men's Health (MSM) site
*(outside of CDC.gov including bookmarked, typed or saved URLs)
Gay and Bisexual Men's Health (MSM)
Source: Adobe SiteCatalyst
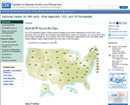
NCHHSTP Atlas
- 97,751 page views to the site, an increase of 96% from 2012
- Visitors spent an average of 3.3 minutes on the site
- External sources* accounted for 44% of the traffic to the site while 56% of the traffic came from visitors that were already visiting CDC.gov and made their way to the NCHHSTP Atlas site
*(outside of CDC.gov including bookmarked, typed or saved URLs)
NCHHSTP Atlas
Source: Adobe SiteCatalyst
NCHHSTP State Health Profiles
- 48,794 page views to the site, comparable with 2013
- Visitors spent an average of 2.9 minutes on the site
- External sources* accounted for 20% of the traffic to the site while 80% of the traffic came from visitors that were already visiting CDC.gov and made their way to the NCHHSTP State Health Profiles site
*(outside of CDC.gov including bookmarked, typed or saved URLs)
NCHHSTP State Health Profiles
Source: Adobe SiteCatalyst
Sexual Health
- 49,528 page views to the site, a decrease of 14% from 2013
- Visitors spent an average of 0.3 minutes on the site
- External sources* accounted for 24% of the traffic to the site while 76% of the traffic came from visitors that were already visiting CDC.gov and made their way to the Sexual Health site
*(outside of CDC.gov including bookmarked, typed or saved URLs)
Sexual Health
Source: Adobe SiteCatalyst
Persons Who Use Drugs (PWUD)
- 48,173 page views to the site, comparable with 2013
- Visitors spent an average of 2.7 minutes on the site
- External sources* accounted for 38% of the traffic to the site while 62% of the traffic came from visitors that were already visiting CDC.gov and made their way to the Persons Who Use Drugs (PWUD) site
*(outside of CDC.gov including bookmarked, typed or saved URLs)
Persons Who Use Drugs (PWUD)
Source: Adobe SiteCatalyst
Correctional Health
- 47,265 page views to the site, comparable with 2013
- Visitors spent an average of 2.7 minutes on the site
- External sources* accounted for 49% of the traffic to the site while 51% of the traffic came from visitors that were already visiting CDC.gov and made their way to the Correctional Health site
*(outside of CDC.gov including bookmarked, typed or saved URLs)
Correctional Health
Source: Adobe SiteCatalyst
Health Disparities
- 37,102 page views to the site, comparable with 2013
- Visitors spent an average of 3.5 minutes on the site
- External sources* accounted for 83% of the traffic to the site while 17% of the traffic came from visitors that were already visiting CDC.gov and made their way to the Health Disparities site
*(outside of CDC.gov including bookmarked, typed or saved URLs)
Health Disparities
Source: Adobe SiteCatalyst
NCHHSTP Program Collaboration & Service Integration (PCSI)
- 31,923 page views to the site, comparable with 2013
- Visitors spent an average of 2.4 minutes on the site
- External sources* accounted for 32% of the traffic to the site while 68% of the traffic came from visitors that were already visiting CDC.gov and made their way to the NCHHSTP Program Collaboration & Service Integration (PCSI) site
*(outside of CDC.gov including bookmarked, typed or saved URLs)
NCHHSTP Program Collaboration & Service Integration (PCSI)
Source: Adobe SiteCatalyst
Office of Infectious Diseases
- 23,581 page views to the site, a increase of 54% from 2013
- Visitors spent an average of 2.2 minutes on the site
- External sources* accounted for 44% of the traffic to the site while 56% of the traffic came from visitors that were already visiting CDC.gov and made their way to the Office of Infectious Diseases site
*(outside of CDC.gov including bookmarked, typed or saved URLs)
Office of Infectious Diseases
Source: Adobe SiteCatalyst
NCHHSTP Prevention Resources for Our Partners and Grantees Site
- 15,523 page views to the site, an increase of 18% from 2013
- Visitors spent an average of 3.5 minutes on the site
- External sources* accounted for 59% of the traffic to the site while 41% of the traffic came from visitors that were already visiting CDC.gov and made their way to the Prevention Resources for Our Partners and Grantees site.
*(outside of CDC.gov including bookmarked, typed or saved URLs)
NCHHSTP Prevention Resources for Our Partners and Grantees Site
Source: Adobe SiteCatalyst
Pregnancy and HIV, Viral Hepatitis, STD, and TB Prevention
- 9,601 page views to the site, a decrease of 23% from 2013
- Visitors spent an average of 0.7 minutes on the site
- External sources* accounted for 10% of the traffic to the site while 90% of the traffic came from visitors that were already visiting CDC.gov and made their way to the Pregnancy and HIV, Viral Hepatitis, STD, and TB Prevention site.
*(outside of CDC.gov including bookmarked, typed or saved URLs)
Pregnancy and HIV, Viral Hepatitis, STD, and TB Prevention
Source: Adobe SiteCatalyst
Prevention Through Health Care
- 8,634 page views to the site in the first year
- Visitors spent an average of 3.8 minutes on the site
- External sources* accounted for 86% of the traffic to the site while 14% of the traffic came from visitors that were already visiting CDC.gov and made their way to the Prevention Through Health Care site.
*(outside of CDC.gov including bookmarked, typed or saved URLs)
Prevention Through Health Care
Source: Adobe SiteCatalyst
BOTUSA
- 7,603 page views to the site, a decrease of 38% from 2013
- Visitors spent an average of 3 minutes on the site
- External sources* accounted for 68% of the traffic to the site while 32% of the traffic came from visitors that were already visiting CDC.gov and made their way to the BOTUSA site
*(outside of CDC.gov including bookmarked, typed or saved URLs)
BOTUSA
Source: Adobe SiteCatalyst
AIDS 2012
- 2,142 page views to the site, a decrease of 23% from 2013
- Visitors spent an average of 4.2 minutes on the site
- External sources* accounted for 69% of the traffic to the site while 31% of the traffic came from visitors that were already visiting CDC.gov and made their way to AIDS 2012 site
*(outside of CDC.gov including bookmarked, typed or saved URLs)
AIDS 2012
Source: Adobe SiteCatalyst

- Page last reviewed: December 21, 2015
- Page last updated: December 21, 2015
- Content source: