

NCHHSTP Cross-cutting Site Metrics (Fiscal Year 2016)
 ShareCompartir
This section of the Dashboard contains metrics for NCHHSTP's cross-cutting topical sites. Using SiteCatalyst, metrics include page views, percent change from previous year (if available), the average time visitors spend, and external or internal sources.
On This Page
Condom Effectiveness
- 533,393 page views to the site, an increase of 24% from 2015
- Visitors spent an average of 3.0 minutes on the site
- External sources* accounted for 70% of the traffic to the site while 30% of the traffic came from visitors that were already visiting CDC.gov and made their way to the Condom Effectiveness site
*(outside of CDC.gov including bookmarked, typed or saved URLs)
Condom Effectiveness
Source: Adobe SiteCatalyst
U.S. Public Health Service Syphilis Study at Tuskegee
- 328,697 page views to the site, a decrease of 2% from 2015
- Visitors spent an average of 8.9 minutes on the site
- External sources* accounted for 86% of the traffic to the site while 14% of the traffic came from visitors that were already visiting CDC.gov and made their way to the U.S. Public Health Service Syphilis Study at Tuskegee site
*(outside of CDC.gov including bookmarked, typed or saved URLs)
Public Health Service Syphilis Study at Tuskegee
Source: Adobe SiteCatalyst
Lesbian, Gay, Bisexual and Transgender Health
- 293,697 page views to the site, a decrease of 8% from 2015
- Visitors spent an average of 3.8 minutes on the site
- External sources* accounted for 72% of the traffic to the site while 28% of the traffic came from visitors that were already visiting CDC.gov and made their way to the Lesbian, Gay, Bisexual and Transgender Health site
*(outside of CDC.gov including bookmarked, typed or saved URLs)
Lesbian, Gay, Bisexual and Transgender Health
Source: Adobe SiteCatalyst
Gay and Bisexual Men's Health (MSM)
- 274,798 page views to the site, an increase of 33% from 2015
- Visitors spent an average of 3.7 minutes on the site
- External sources* accounted for 79% of the traffic to the site while 21% of the traffic came from visitors that were already visiting CDC.gov and made their way to the Gay and Bisexual Men's Health (MSM) site
*(outside of CDC.gov including bookmarked, typed or saved URLs)
Gay and Bisexual Men's Health (MSM)
Source: Adobe SiteCatalyst
NCHHSTP Newsroom
- 222,192 page views to the site, a decrease of 13% from 2015
- Visitors spent an average of 4.6 minutes on the site
- External sources* accounted for 85% of the traffic to the site while 15% of the traffic came from visitors that were already visiting CDC.gov and made their way to the NCHHSTP Newsroom site
*(outside of CDC.gov including bookmarked, typed or saved URLs)
NCHHSTP Newsroom
Source: Adobe SiteCatalyst
NCHHSTP Atlas
- 150,224 page views to the site, an increase of 46% from 2015
- Visitors spent an average of 3.0 minutes on the site
- External sources* accounted for 51% of the traffic to the site while 49% of the traffic came from visitors that were already visiting CDC.gov and made their way to the NCHHSTP Atlas site
*(outside of CDC.gov including bookmarked, typed or saved URLs)
NCHHSTP Atlas
Source: Adobe SiteCatalyst

Social Determinants of Health
- 141,858 page views to the site, a decrease of 39% from 2015
- Visitors spent an average of 5.6 minutes on the site
- External sources* accounted for 80% of the traffic to the site while 20% of the traffic came from visitors that were already visiting CDC.gov and made their way to the Social Determinants of Health site
*(outside of CDC.gov including bookmarked, typed or saved URLs)
Social Determinants of Health
Source: Adobe SiteCatalyst
Sexual Health
- 51,956 page views to the site, a decrease of 4% from 2015
- Visitors spent an average of 1.7 minutes on the site
- External sources* accounted for 53% of the traffic to the site while 47% of the traffic came from visitors that were already visiting CDC.gov and made their way to the Sexual Health site
*(outside of CDC.gov including bookmarked, typed or saved URLs)
Sexual Health
Source: Adobe SiteCatalyst
Persons Who Use Drugs (PWUD)
- 51,260 page views to the site, an increase of 17% from 2015
- Visitors spent an average of 2.1 minutes on the site
- External sources* accounted for 44% of the traffic to the site while 56% of the traffic came from visitors that were already visiting CDC.gov and made their way to the Persons Who Use Drugs (PWUD) site
*(outside of CDC.gov including bookmarked, typed or saved URLs)
Persons Who Use Drugs (PWUD)
Source: Adobe SiteCatalyst
NCHHSTP State Health Profiles
- 47,330 page views to the site, an increase of 23% from 2015
- Visitors spent an average of 2.5 minutes on the site
- External sources* accounted for 19% of the traffic to the site while 81% of the traffic came from visitors that were already visiting CDC.gov and made their way to the NCHHSTP State Health Profiles site
*(outside of CDC.gov including bookmarked, typed or saved URLs)
NCHHSTP State Health Profiles
Source: Adobe SiteCatalyst
Health Disparities
- 41,360 page views to the site, an increase of 3% from 2015
- Visitors spent an average of 3.7 minutes on the site
- External sources* accounted for 86% of the traffic to the site while 14% of the traffic came from visitors that were already visiting CDC.gov and made their way to the Health Disparities site
*(outside of CDC.gov including bookmarked, typed or saved URLs)
Health Disparities
Source: Adobe SiteCatalyst
Correctional Health
- 41,252 page views to the site, a decrease of 13% from 2015
- Visitors spent an average of 2.5 minutes on the site
- External sources* accounted for 52% of the traffic to the site while 48% of the traffic came from visitors that were already visiting CDC.gov and made their way to the Correctional Health site
*(outside of CDC.gov including bookmarked, typed or saved URLs)
Correctional Health
Source: Adobe SiteCatalyst
Office of Infectious Diseases
- 31,801 page views to the site, an increase of 5% from 2015
- Visitors spent an average of 2.0 minutes on the site
- External sources* accounted for 51% of the traffic to the site while 49% of the traffic came from visitors that were already visiting CDC.gov and made their way to the Office of Infectious Diseases site
*(outside of CDC.gov including bookmarked, typed or saved URLs)
Office of Infectious Diseases
Source: Adobe SiteCatalyst
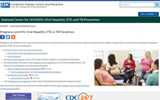
Prevention Through Health Care
- 15,434 page views to the site, an increase of 6% from 2015
- Visitors spent an average of 3.3 minutes on the site
- External sources* accounted for 87% of the traffic to the site while 13% of the traffic came from visitors that were already visiting CDC.gov and made their way to the Prevention Resources for Our Partners and Grantees site
*(outside of CDC.gov including bookmarked, typed or saved URLs)
Prevention Through Health Care
Source: Adobe SiteCatalyst
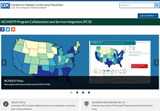
NCHHSTP Program Collaboration & Service Integration (PCSI)
- 12,225 page views to the site, a decrease of 34% from 2015
- Visitors spent an average of 2.8 minutes on the site
- External sources* accounted for 61% of the traffic to the site while 39% of the traffic came from visitors that were already visiting CDC.gov and made their way to the NCHHSTP Program Collaboration & Service Integration (PCSI) site
*(outside of CDC.gov including bookmarked, typed or saved URLs)
NCHHSTP Program Collaboration & Service Integration (PCSI)
Source: Adobe SiteCatalyst
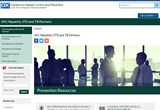
NCHHSTP Prevention Resources for Our Partners and Grantees Site
- 11,948 page views to the site, a decrease of 34% from 2015
- Visitors spent an average of 3.5 minutes on the site
- External sources* accounted for 59% of the traffic to the site while 41% of the traffic came from visitors that were already visiting CDC.gov and made their way to the Prevention Resources for Our Partners and Grantees site
*(outside of CDC.gov including bookmarked, typed or saved URLs)
NCHHSTP Prevention Resources for Our Partners and Grantees Site
Source: Adobe SiteCatalyst
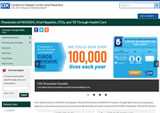
Pregnancy and HIV, Viral Hepatitis, STD, and TB Prevention
- 6,006 page views to the site, a decrease of 9% from 2015
- Visitors spent an average of 0.9 minutes on the site
- External sources* accounted for 11% of the traffic to the site while 89% of the traffic came from visitors that were already visiting CDC.gov and made their way to the Pregnancy and HIV, Viral Hepatitis, STD, and TB Prevention site.
*(outside of CDC.gov including bookmarked, typed or saved URLs)
Pregnancy and HIV, Viral Hepatitis, STD, and TB Prevention
Source: Adobe SiteCatalyst

- Page last reviewed: December 30, 2016
- Page last updated: December 30, 2016
- Content source: