

NCHHSTP Division Site Metrics (Fiscal Year 2016)
 ShareCompartir
This section of the Dashboard contains metrics for NCHHSTP's five divisions. Using SiteCatalyst, metrics include page views, percent change from previous year (if available), the average time visitors spend, and external or internal sources.
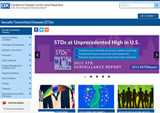
STD Prevention
Overview
- 71,680,981 page views to the site, an increase of 4% from 2015
- Visitors spent an average of 7.1 minutes on the site
- External sources* accounted for 94.6% of the traffic to the site while 5.4% of the traffic came from visitors that were already visiting CDC.gov and made their way to the STD Prevention site
*(outside of CDC.gov including bookmarked, typed or saved URLs)
STD Prevention
Adobe SiteCatalyst
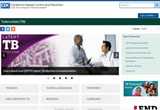
Tuberculosis Elimination
Overview
- 14,515,106 page views to the site, an increase of 21% from 2015
- Visitors spent an average of 5.6 minutes on the site
- External sources* accounted for 79.1% of the traffic to the site while 20.9% of the traffic came from visitors that were already visiting CDC.gov and made their way to the Tuberculosis Elimination site
*(outside of CDC.gov including bookmarked, typed or saved URLs)
Tuberculosis Elimination
Adobe SiteCatalyst
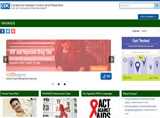
HIV/AIDS Prevention
Overview
- 11,876,089 page views to the site, an increase of 15% from 2015
- Visitors spent an average of 5.2 minutes on the site
- External sources* accounted for 88% of the traffic to the site while 12% of the traffic came from visitors that were already visiting CDC.gov and made their way to the HIV/AIDS Prevention site
*(outside of CDC.gov including bookmarked, typed or saved URLs)
HIV/AIDS Prevention
Adobe SiteCatalyst
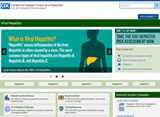
Viral Hepatitis
Overview
- 5,901,164 page views to the site, a decrease of 7% from 2015
- Visitors spent an average of 4.5 minutes on the site
- External sources* accounted for 79% of the traffic to the site while 21% of the traffic came from visitors that were already visiting CDC.gov and made their way to the Viral Hepatitis site
*(outside of CDC.gov including bookmarked, typed or saved URLs)
Viral Hepatitis
Adobe SiteCatalyst
Adolescent and School Health
Overview
The Division of Adolescent and School Health (DASH) web site, http://www.cdc.gov/healthyyouth/, highlights activities and information related to DASH’s mission to promote environments where teens can gain fundamental health knowledge and skills, establish healthy behaviors for a lifetime, connect to health services, and avoid becoming pregnant or infected with HIV or STDs.
In FY15, the Division of Adolescent and School Health (DASH) shared its web site with the National Center for Chronic Disease Prevention and Health Promotion (NCCDPHP), Division of Population Health (DPH)/School Health Branch (SHB). On September 1, 2015, DASH launched a new Healthy Youth web site that no longer houses content from NCCDPHP.
- 1,832,848 page views to the site, a decrease of 6% from 2015
- Visitors spent an average of 3.59 minutes on the site
- External sources* accounted for 67% of the traffic to the site while 33% of the traffic came from visitors that were already visiting CDC.gov and made their way to the Adolescent and School Health site
*(outside of CDC.gov including bookmarked, typed or saved URLs)
Adolescent and School Health
Adobe SiteCatalyst


- Page last reviewed: December 30, 2016
- Page last updated: December 30, 2016
- Content source: