

Figure Y. Primary and Secondary Syphilis — Estimated Rates of Reported Cases Among MSM† by State, United States, 2016
 ShareCompartir
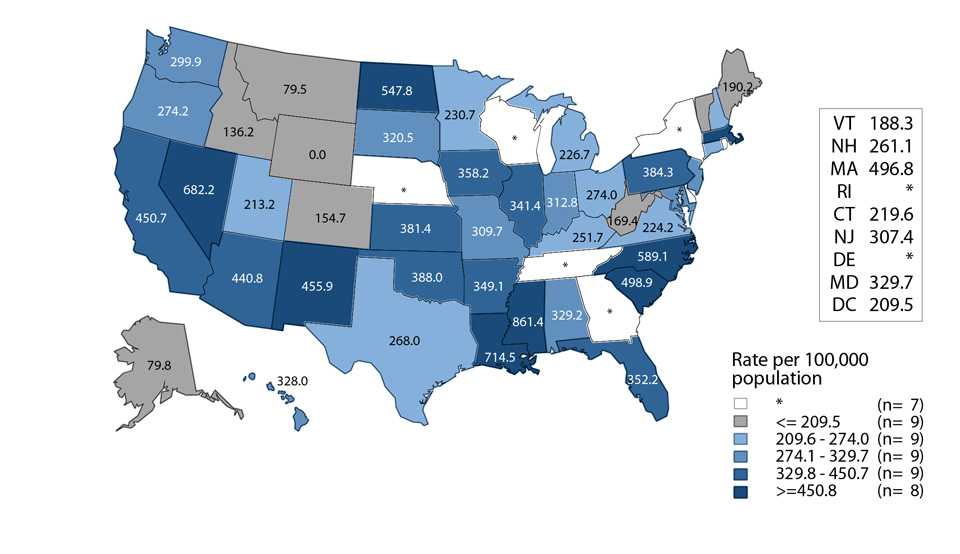
* States reporting less than 70% of cases identified as MSM†, MSW†, or women in 2016 are suppressed.
† MSM = Gay, bisexual, and other men who have sex with men (collectively referred to as MSM); MSW = Men who have sex with women only.
NOTE: Estimates based on reported P&S syphilis cases among MSM in 2016 (numerator) and a published method of estimating the population size of MSM (denominator) by state. See Section A1.2 in the Appendix for information on estimating MSM population sizes for rate denominators.
- Page last reviewed: September 26, 2017
- Page last updated: September 26, 2017
- Content source: