

Figure F. Chlamydia — Positivity* Among Women Aged 14–39 Years by Race/Ethnicity and Age Group in Clinics† Providing Family Planning and Reproductive Health Services, STD Surveillance Network (SSuN), 2016
 ShareCompartir
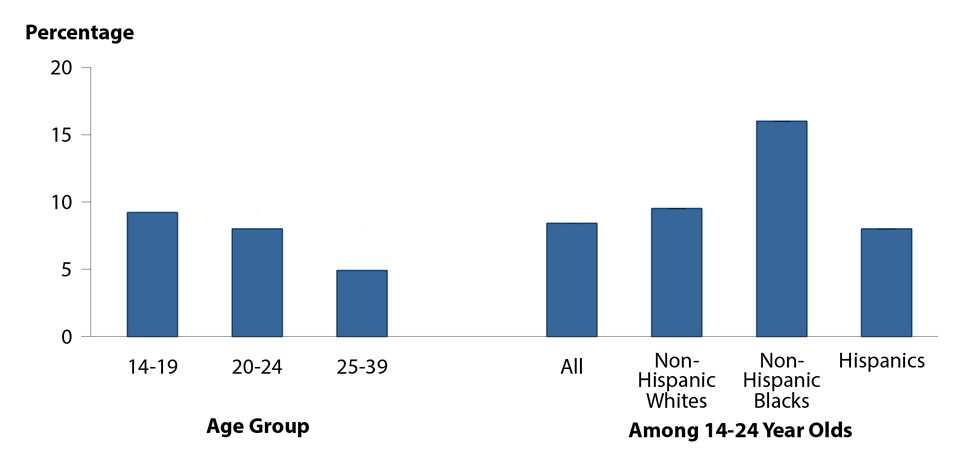
* Positivity represents the overall average of the mean value by jurisdiction.
† Only clinics that tested >100 women for chlamydia and those with testing coverage >60% were included (n = 58).
NOTE: See section A2.2 in the Appendix for SSuN methods.
- Page last reviewed: September 26, 2017
- Page last updated: September 26, 2017
- Content source: