

Figure EE. Gonorrhea — Proportion* of MSM† Attending STD Clinics Testing Positive for Oropharyngeal Gonorrhea by Jurisdiction, STD Surveillance Network (SSuN), 2016
 ShareCompartir
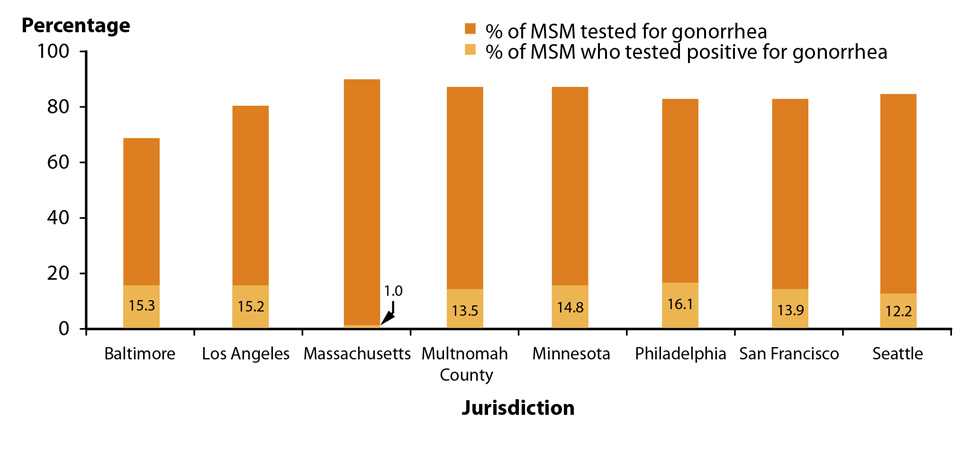
* Results based on data obtained from 15,190 patients tested for oropharyngeal gonorrhea attending SSuN STD clinics in 2016; data from Florida and New York city was not available.
† MSM = Gay, bisexual, and other men who have sex with men (collectively referred to as MSM).
NOTE: See section A2.2 in the Appendix for SSuN methods.
- Page last reviewed: September 26, 2017
- Page last updated: September 26, 2017
- Content source: