

Figure BB. Gonorrhea — Estimated* Rates of Reported Gonorrhea Cases by MSM†, MSW†, and Women, STD Surveillance Network (SSuN)‡, 2010–2015
 ShareCompartir
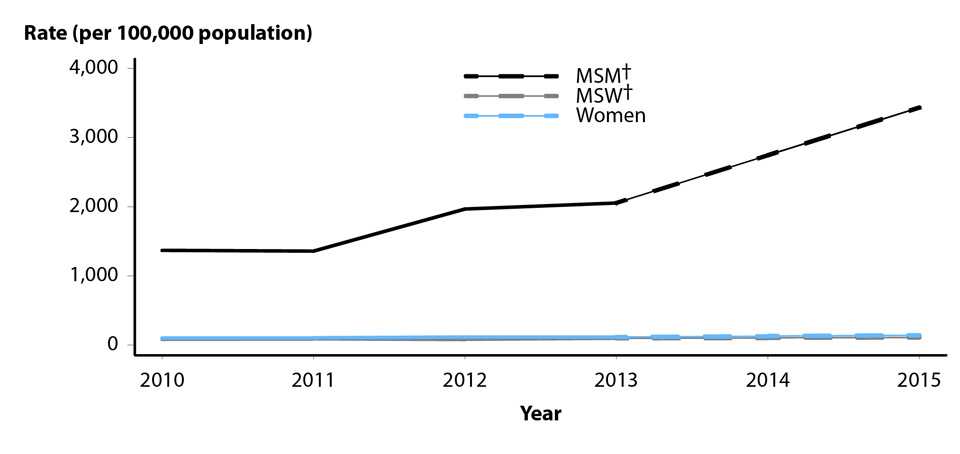
* Estimates based on interviews among a random sample of reported cases of gonorrhea (N=14,080); cases weighted for analysis.
† MSM = Gay, bisexual, and other men who have sex with men (collectively referred to as MSM); MSW = Men who have sex with women only.
‡ Sites include Baltimore, Philadelphia, New York City, Washington State, San Francisco, and California (excluding San Francisco).
NOTE: Data not available for 2014; 2013–2015 trend interpolated shown in dashed line; trends lines overlap for MSW and Women in this figure. See section A2.2 in the Appendix for SSuN methods.
SOURCE: Stenger M, Pathela P, Anschuetz G, et al. Increases in the rate of Neisseria gonorrhoeae among gay, bisexual and other men who have sex with men (MSM) — findings from the STD Surveillance Network 2010–2015. Sex Transm Dis 2017; 44(7):393–397.
- Page last reviewed: September 26, 2017
- Page last updated: September 26, 2017
- Content source: