Skip directly to search Skip directly to A to Z list Skip directly to page options Skip directly to site content

Figure 47. Cervical Low- and High-Grade Squamous Intraepithelial Lesions and Intraepithelial Neoplasia Grades 2 and 3 — Prevalence per 1000 Person-Years Among Female Enrollees in Private Health Plans Aged 15–39 Years, by Age Group and Year, 2007–2014

Figure 47. Line graphs showing prevalence per 1000-person years of cervical Low- and High-Grade Squamous Intraepithelial Lesions and Intraepithelial Neoplasia Grades 2 and 3 during 2007 to 2014 among female enrollees in private health plans aged 15 to 39 years, by age group and year. Figure 47A shows low-grade Squamous Intraepithelial Lesions; figure 47B shows High-Grade Squamous Intraepithelial Lesions; and figure 47C shows cervical Intraepithelial Neoplasia Grades 2 and 3. The data represented in this figure can be downloaded at www.cdc.gov/std/stats16/figures/OtherFigureData.zip.Figure 47. Line graphs showing prevalence per 1000-person years of cervical Low- and High-Grade Squamous Intraepithelial Lesions and Intraepithelial Neoplasia Grades 2 and 3 during 2007 to 2014 among female enrollees in private health plans aged 15 to 39 years, by age group and year. Figure 47A shows low-grade Squamous Intraepithelial Lesions; figure 47B shows High-Grade Squamous Intraepithelial Lesions; and figure 47C shows cervical Intraepithelial Neoplasia Grades 2 and 3. The data represented in this figure can be downloaded at www.cdc.gov/std/stats16/figures/OtherFigureData.zip.Figure 47. Line graphs showing prevalence per 1000-person years of cervical Low- and High-Grade Squamous Intraepithelial Lesions and Intraepithelial Neoplasia Grades 2 and 3 during 2007 to 2014 among female enrollees in private health plans aged 15 to 39 years, by age group and year. Figure 47A shows low-grade Squamous Intraepithelial Lesions; figure 47B shows High-Grade Squamous Intraepithelial Lesions; and figure 47C shows cervical Intraepithelial Neoplasia Grades 2 and 3. The data represented in this figure can be downloaded at www.cdc.gov/std/stats16/figures/OtherFigureData.zip.

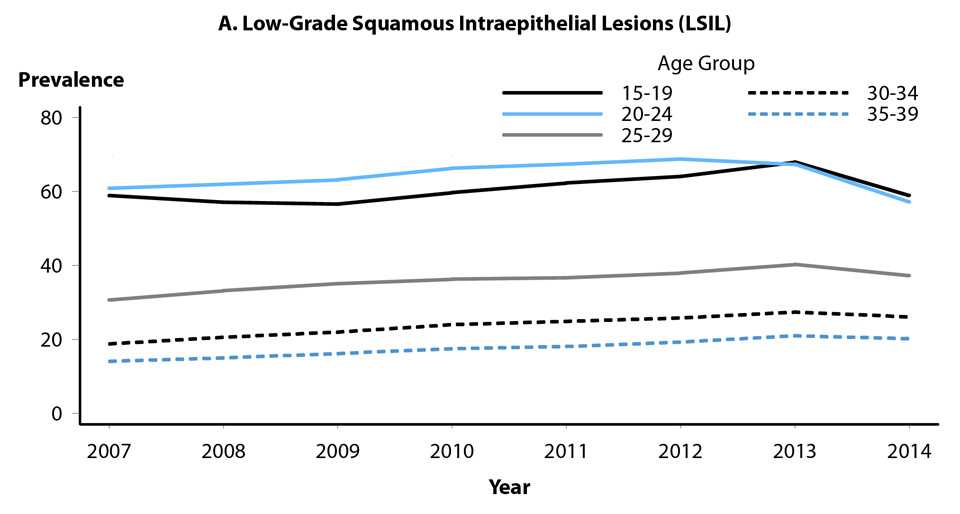
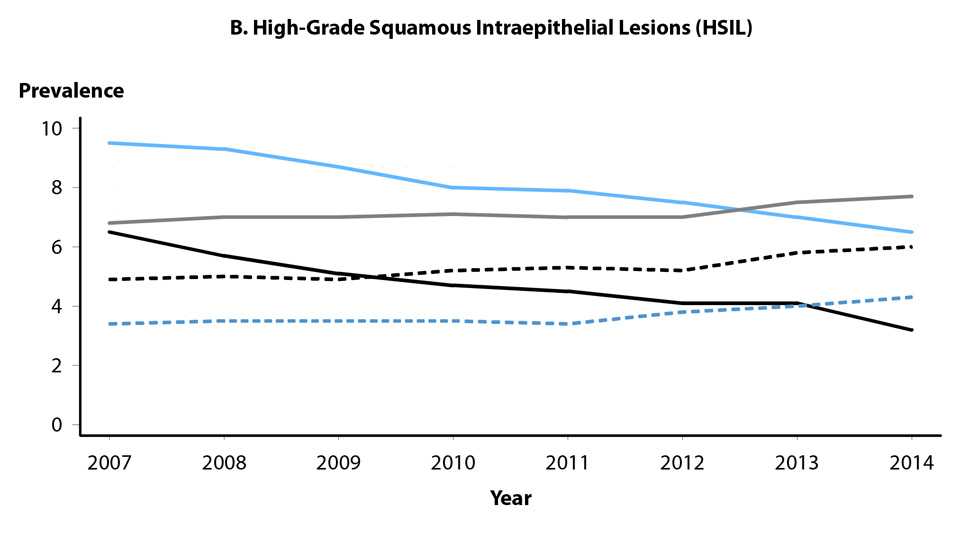
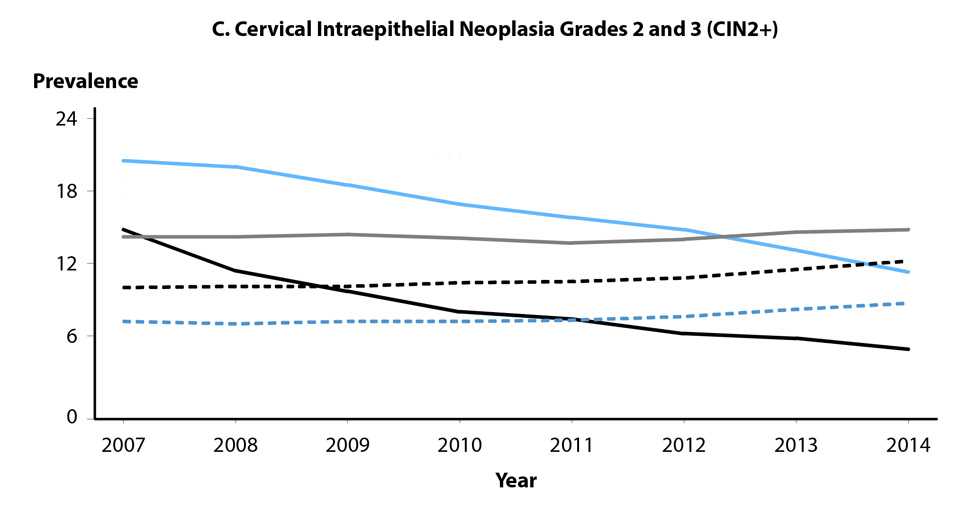
SOURCE:  Flagg EW, Torrone EA, Weinstock H. Ecological Association of Human Papillomavirus Vaccination with Cervical Dysplasia Prevalence in the United States, 2007–2014. Am J Public Health 2016; 106(12):2211–2218.

The data represented in this figure can be downloaded at www.cdc.gov/std/stats16/figures/OtherFigureData.zip.

Next

TOP