

Lesson 5: Public Health Surveillance
 ShareCompartir
Appendix C. Examples of Surveillance
Surveillance for Consumer Product-Related Injuries
The U.S. Consumer Product Safety Commission's (CPSC) National Electronic Injury Surveillance System (NEISS) is a national probability sample of hospitals in the United States and its territories (Figure 5.11). Patient information is collected from each NEISS hospital for every emergency department (ED) visit involving an injury associated with consumer products. From this sample, the total number of product-related injuries treated in hospital EDs nationwide can be estimated.
Figure 5.11 U.S. Consumer Product Safety Commission NEISS Hospitals, 2003
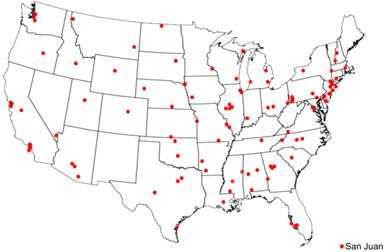
Source: NEISS: The National Electronic Injury Surveillance System — A Tool for Researchers [monograph on the Internet]. Washington (DC): U.S. Consumer Product Safety Commission, Division of Hazard and Injury Data Systems [updated 2000 Mar; cited 2005 Dec 2]. Available from: http://www.cpsc.gov/neiss/2000d015.pdf.
The data-collection process begins when a patient in the ED of an NEISS hospital relates to a clerk, nurse, or physician how the injury occurred. The ED staff enters this information in the patient's medical record. Each day, a person designated as an NEISS coordinator examines the records for within-scope cases. The NEISS coordinator is someone designated by the hospital who is given access to the ED records. NEISS coordinator duties are sometimes performed by an ED staff member and sometimes by a person under contract to CPSC. CPSC data-collection specialists train NEISS coordinators and conduct ED staff orientation during on-site hospital visits. For all within-scope cases, the NEISS coordinator abstracts information for the specified NEISS variables. The coordinator uses an NEISS coding manual to apply numerical codes to the NEISS variables. For CPSC, the key variable is the one that identifies any consumer product mentioned. The coordinator is trained to be as specific as possible in selecting among the approximately 900 product codes in the NEISS coding manual. Another essential variable is the free-text narrative description from the ED record of the incident scenario. Up to two lines of text are provided for this narrative that often describes what the patient was doing at the time of the accident. The specific NEISS variables are listed as follows:
Basic Surveillance Record Variables (before year 2000 expansion)
- Treatment date.
- Case record number.
- Patient's age.
- Patient's sex.
- Injury diagnosis.
- Body part affected.
- Disposition (e.g., treated and released or hospitalized).
- Product(s) mentioned.
- Locale.
- Fire or motor-vehicle involvement.
- Whether work-related.
- Race or ethnicity.
- Incident scenario.
- Whether intentionally inflicted (year 2000 expansion).
NEISS continuously monitors product-related injuries treated in the 100 hospital EDs that comprise the probability sample. Within-scope injuries examined in these EDs are reported to CPSC year-round on a daily basis. Thus, daily, weekly, monthly, seasonal, or episodic trends can be observed. Numerous published articles have used NEISS data to characterize consumer product-related injuries.(30–32)
Surveillance for Asthma
CDC conducts national surveillance for asthma, a chronic disease that affects the respiratory system among both children and adults. Because of its high prevalence and substantial morbidity, asthma has been the focus of clinical and public health interventions, and surveillance has been helpful in quantifying its prevalence and tracking its trend.
In conducting surveillance, CDC uses multiple sources of data because of asthma's broad spectrum of severity, which ranges from occasional, self-managed episodes to attacks requiring hospitalization, and rarely, resulting in death. Asthma-related health effects under surveillance and the data systems used to monitor them are as follows:
- Self-reported asthma prevalence, self-reported asthma episodes or attacks, school and work days lost because of asthma, and asthma-associated activity limitations are obtained from the National Health Interview Survey.
- Asthma-associated outpatient visits are obtained from the National Ambulatory Medical Care Survey.
- Asthma-associated ED and hospital outpatient visits are obtained from the National Hospital Ambulatory Medical Care Survey.
- Asthma-associated hospitalizations are obtained from the National Hospital Discharge Survey.
- Asthma-associated deaths are obtained from the Mortality Component of the National Vital Statistics System.
Data from these systems and from the U.S. Census Bureau are analyzed to produce national and regional estimates of asthma-related effects, including rates (see Figure 5.12 for examples of these estimates).
Two reports summarizing the findings of surveillance for asthma have been published; the first, in 1998(33) and the second in 2002(34). The reports present findings in a series of tables and graphs. Efforts are under way to improve surveillance for asthma by obtaining state-level data on its prevalence, developing methods to estimate the incidence of asthma by using data from EDs, and improving the timeliness of reporting of asthma-related deaths so that they can be investigated to determine how such deaths might have been prevented.
Figure 5.12. Asthma Prevalence, Morbidity, and Mortality Rates — United States, 1960–1999
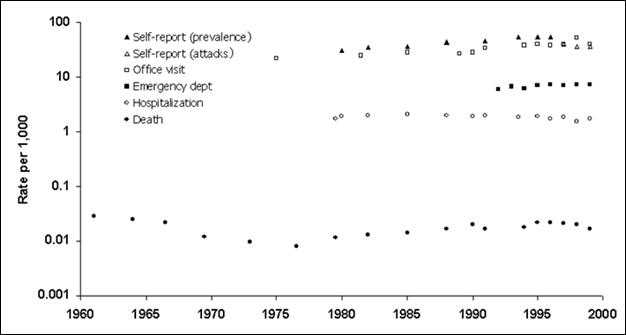
Data Sources: Mannino DM, Homa DM, Pertowski CA, et al. Surveillance for asthma—United States, 1960–1995. In: Surveillance Summaries, April 24, 1998. MMWR 1998;47(No. SS-1):1–28, and Mannino DM, Homa DM, Akinbami LJ, Moorman JE, Gwynn C, Redd SC. Surveillance for Asthma—United States, 1980–1999. In: Surveillance Summaries, March 29, 2002. MMWR 2002;51(No. SS-1):1–13.
Surveillance for Influenza
Reporting from states to the Centers for Disease Control and Prevention (CDC) is not limited to notifiable diseases. Surveillance for influenza is one such example. Because influenza can be widespread during the winter but its diagnosis is rarely confirmed by laboratory test, surveillance for influenza has presented challenges that have been met by using a combination of different sources of data.
At the state and local levels, health authorities receive reports of outbreaks of influenza-like illness, laboratory identification of influenza virus from nasopharyngeal swabs, and reports from schools of excess absenteeism (e.g., >10% of a school's student body). In addition, certain local systems monitor death certificates for pneumonia and influenza, arrange for selected physicians to report the number of patients they examine with influenza-like illness each week, and ask selected businesses and schools to report excessive employee absenteeism. At least one type of surveillance for influenza includes pharmacy reports of the number of prescriptions of antiviral drugs used to treat influenza. Another health department monitors the number of chest radiographs a mobile radiology group performs of nursing home patients; >50% of the total chest radiographs ordered is used as a marker of increased influenza activity.
At the national level, CDC collects and analyzes data weekly from seven different data systems to assess influenza activity.
- The laboratory-based system receives reports of the number of percentage of influenza isolates from approximately 125 laboratories located throughout the United States. Selected isolates are sent to CDC for additional testing.
- The U.S. Influenza Sentinel Providers Surveillance Network receives reports of the number and percentage of patients examined with influenza-like illness by age group from a network of approximately 1,000 health-care providers.
- The 122 City Mortality Reporting System receives counts of deaths and the proportion of those deaths attributable to pneumonia and influenza from 122 cities and counties across the country.
- Each state and territorial health department provides an assessment of influenza activity in the state as either "No Activity," "Sporadic," "Local," "Regional," or "Widespread."
- Influenza-associated pediatric mortality (defined as laboratory-confirmed influenza-associated death among children aged <18 years) is now a nationally notifiable condition and is reported through the National Notifiable Disease Surveillance System.
- Emerging Infections Program conducts surveillance for laboratory-confirmed influenza-related hospitalizations among persons aged <18 years in 11 metropolitan areas in 10 states.
By using multiple data sources at all levels — local, state, and national — public health officials are able to assess influenza activity reliably throughout the United States without asking every health-care provider to report each individual case.
References (This Section)
- Hopkins RS. Consumer product-related injuries in Athens, Ohio, 1980-85: assessment of emergency room-based surveillance. Am J Prev Med 1989 Mar-Apr;5(2):104–12.
- Schrieber, R.A., Branche-Dorsey, C.M., Ryan, G.W. et al. Risk factors for injuries from in-line skating and the effectiveness of safety gear. N Engl J Med 1996;335:1630–1635.
- NEISS: The National Electronic Injury Surveillance System — A Tool for Researchers [monograph on the Internet]. Washington (DC): U.S. Consumer Product Safety Commission, Division of Hazard and Injury Data Systems [updated 2000 Mar; cited 2005 Dec 2]. Available from: http://www.cpsc.gov/neiss/2000d015.pdf.
- Mannino DM, Homa DM, Pertowski CA, et al. Surveillance for asthma — United States, 1960–1995. In: Surveillance Summaries, April 24, 1998. MMWR 1998;47(No. SS- 1):1–28.
- Mannino DM, Homa DM, Akinbami LJ, Moorman JE, Gwynn C, Redd SC. Surveillance for Asthma—United States, 1980–1999. In: Surveillance Summaries, March 29, 2002. MMWR 2002;51(No. SS-1):1–13.
Previous Page Next Page: Appendix D
Alternate Text Description for Images
Figure 5.12
Description: A dot plot shows prevalence of self-reporting, self-reported attacks, office visits, emergency department visits, hospitalization, and death due to asthma. Return to text.
- Page last reviewed: May 18, 2012
- Page last updated: May 18, 2012
- Content source: