White blood cell differential
A white blood cell differential is a medical laboratory test that provides information about the types and amounts of white blood cells in a person's blood. The test, which is usually ordered as part of a complete blood count (CBC), measures the amounts of the five normal white blood cell types – neutrophils, lymphocytes, monocytes, eosinophils and basophils – as well as abnormal cell types if they are present. These results are reported as percentages and absolute values, then compared against reference ranges to determine whether the values are normal, low, or high. Changes in the amounts of white blood cells can aid in the diagnosis of many health conditions, including viral, bacterial, and parasitic infections and blood disorders such as leukemia.
| White blood cell differential | |
|---|---|
| Medical diagnostics | |
.JPG) | |
| Synonyms | Differential leukocyte count,[1] leukogram,[2] autodiff,[3] manual diff[1] |
| Purpose | Describing populations of white blood cells in peripheral blood |
| MedlinePlus | 003657 |
| eMedicine | 2085133 |
| LOINC | 33255-1, 24318-8, 69738-3 |
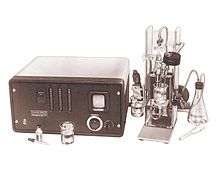
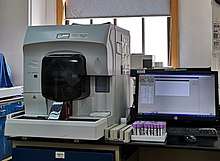
White blood cell differentials may be performed by an automated analyzer – a machine designed to run laboratory tests – or manually, by examining blood smears under a microscope. The test was performed manually until white blood cell differential analyzers were introduced in the 1970s, making the automated differential possible. In the automated differential, a blood sample is loaded onto an analyzer, which samples a small volume of blood and measures various properties of white blood cells to produce a differential count. The manual differential, in which a medical laboratory scientist counts white blood cells on a stained microscope slide, is now performed to investigate abnormal or questionable results from the automated differential, or upon request by the healthcare provider. The manual differential can identify cell types that are not counted by automated methods and detect clinically significant changes in the appearance of white blood cells.
In 1675, Antonie van Leeuwenhoek published the first microscopic observations of blood cells, writing that blood consisted of "small red globules". Improvements in microscope technology throughout the 18th and 19th centuries allowed the cellular components of blood to be identified and counted. In the 1870s, Paul Ehrlich invented a staining technique that could differentiate between each type of white blood cell. Dmitri Leonidovich Romanowsky later modified Ehrlich's stain to produce a wider range of colours, creating the Romanowsky stain, which is still used to stain blood smears for manual differentials.
Automation of the white blood cell differential began with the invention of the Coulter counter, the first automated hematology analyzer, in the early 1950s. This machine used electrical impedance measurements to count cells and determine their sizes, allowing white and red blood cells to be enumerated. A cell sorting technique developed in 1965 related the sizes of white blood cells, as measured by Coulter counting, to cell types, enabling later methods which used cell size histograms to produce differential white blood cell counts. Throughout the 1970s, a number of methods were developed to improve cell identification, such as light scattering measurements and fluorescent staining. Hematology analyzers now use combinations of these and other methods to produce white blood cell differential results.
Medical uses
The white blood cell differential is a common blood test that is often ordered alongside a complete blood count. The test may be performed as part of a routine medical examination; to investigate certain symptoms, particularly those suggestive of infection or hematological disorders;[5][6] or to monitor existing conditions, such as blood disorders and inflammatory diseases.[7]:33
Five types of white blood cells are normally found in blood: neutrophils, lymphocytes, monocytes, eosinophils and basophils.[8]:303 Marked shifts in the proportions of these cell types, as measured by the automated or manual differential, can indicate various health conditions.[9] Additionally, cell types which do not normally occur in the blood, such as blast cells, can be identified by the manual differential. These cell types may be found in blood disorders and other pathological states.[10][11] The manual differential can also identify changes in the appearance of white blood cells, such as reactive lymphocytes,[12]:95–7 or features such as toxic granulation and vacuolation in neutrophils.[13]:153 The results of the white blood cell differential are reported as percentages and absolute values. Absolute counts are usually reported in units of cells per microliter (µL) or 109 cells per liter (L).[6]
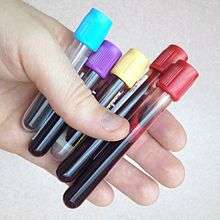
CBC and differential testing can be performed on venous or capillary blood. Capillary blood draws are generally used for infants and individuals whose veins are difficult to access.[12]:2–4 To prevent clotting, the sample is drawn into a tube containing the anticoagulant compound ethylenediaminetetraacetic acid (EDTA).[14]:183 Tubes containing sodium citrate may also be used for patients in whom EDTA causes platelet clumping.[15] The test is performed on whole blood, meaning blood that has not been centrifuged.[4]:116
History
The first microscopic observations of blood cells were published by Antonie van Leeuwenhoek in 1675. Using a microscope of his own design, van Leeuwenhoek discovered that blood consisted of "small red globules, driven through a crystalline humidity of water".[16] Throughout the 18th and 19th centuries, further improvements in microscope technology such as the invention of achromatic lenses allowed white blood cells and platelets to be counted in unstained blood samples. In the 1870s, Paul Ehrlich developed a staining technique that could differentiate between the five white blood cell types. Ehrlich's stain used a combination of an acidic and basic dye to stain white and red blood cells simultaneously.[16] Dmitri Leonidovich Romanowsky improved on this technique in the 1890s by using a mixture of eosin and aged methylene blue, which produced a wide range of hues that was not present when either of the stains was used alone. This was termed the Romanowsky effect and became the basis for Romanowsky staining, the technique that is still used to stain blood smears for manual differentials.[17]
The first automated hematology analyzer, the Coulter counter, was invented in the early 1950s by Wallace H. Coulter and Joseph A. Coulter.[18]:794[19] The analyzer worked on the Coulter principle, which states that when cells are suspended in a fluid carrying an electric current and passed through an aperture, they cause decreases in current proportional to their volume because of their poor electrical conductivity. The number and magnitude of these decreases can be used to count blood cells and calculate their sizes. The Coulter counter was initially designed for counting red blood cells, but it proved effective for counting white blood cells as well.[19]
In 1967, M. J. Fulwyler used a modified version of the Coulter counter to sort white blood cells by size.[20] This cell sorting method was based on a technology invented by R. G. Sweet for use in inkjet printers, which used electrostatic deflection to position ink droplets.[21][22] Fulwyler's method used Coulter counting to determine the volume of the white blood cells, then partitioned cells into fluid droplets and applied charges based on the cells' sizes, allowing them to be sorted into collection vessels by volume. The collected cells could then undergo further analysis.[23][24]
Using this method, Fulwyler found that human white blood cells formed three distinct peaks when their volumes were plotted on a histogram. By microscopically examining cells from each peak, he determined that the smallest-volume peak mainly contained lymphocytes, the intermediate-volume peak contained neutrophils, and the largest-volume peak contained a mixture of granulocytes and monocytes.[20] Other researchers applied Fulwyler's techniques to generate automated neutrophil counts, although counts for other cell types were not as reliable.[25] In 1983, the Coulter S Plus system, a commercial analyzer that produced a three-part differential of neutrophils, monocytes and lymphocytes based on cell size histograms, was introduced.[16] The principle of identifying white blood cells by their sizes is still used in many hematology analyzers, although other techniques are used to improve discrimination between white blood cell types.[11]
In the late 1960s and early 1970s, researchers began to combine Coulter counting techniques with analysis of the optical properties of cells.[24] These devices, such as Kamentsky's Cytofluorograph[26] and Dittrich & Goehde's Impulscytometer,[27] shot beams of light at cells in specific wavelengths and measured the resulting absorbance or fluorescence, allowing cellular contents such as DNA to be quantified.[22] Other researchers refined these techniques by using fluorescent dyes (fluorophores), which bind to specific components of cells to improve discrimination between cell types.[28]
Meanwhile, other researchers such as George & Groner[24] and Ansley & Ornstein[22] focused on using light scattering patterns to classify cells. By directing a laser at individual cells and measuring the light scattered at different angles, various features of white blood cells can be ascertained; the light scattered within 1 to 10 degrees of the beam's axis (forward scatter) describes cellular size, while light scattered at a 90 degree angle (side scatter) describes granularity.[14]:234 Ansley & Ornstein's work, along with later improvements by Mansfield,[22] resulted in the first commercial flow cytometric differential analyzer, the Hemalog D.[29][30] Introduced in 1974,[29] this analyzer used light scattering and three different staining channels to identify the five normal white blood cell types and what were referred to as large unstained cells, a classification that usually consisted of atypical lymphocytes or blast cells. The Hemalog D could count 10,000 cells in one run, a massive improvement over the 100-cell manual differential, and it decreased the workload in the hematology laboratory as samples that were identified as normal did not require a manual smear review.[31]
In 1981, Technicon combined the Hemalog D with the Hemalog-8 CBC analyzer to produce the Technicon H6000, the first combined CBC and differential analyzer. This analyzer was unpopular with hematology laboratories because it was labour-intensive to operate. However, in the late 1980s to early 1990s similar systems were widely produced by other manufacturers such as Sysmex, Abbott, Roche and Beckman Coulter.[7]:8–9
Types
Manual differential
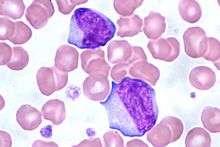
In a manual differential, a medical laboratory scientist[6] examines a stained blood smear under a microscope and counts and classifies white blood cells based on their appearance. A manual differential is usually performed when the automated differential is flagged for review or when the healthcare provider requests it.[1][9] If the manual differential shows findings suggestive of certain serious conditions, such as leukemia, the blood smear is referred to a physician (generally a hematologist or pathologist) for confirmation.[1]
Procedure
A blood smear is prepared by placing a drop of blood on a microscope slide and using a second slide held at a 30 to 45 degree angle to spread the blood and pull it across the slide, forming a "feathered edge" consisting of a single layer of cells at the end of the smear.[8]:346–8 This may be done by hand or using an automated slide maker coupled to a hematology analyzer. The slide is treated with a Romanowsky stain, commonly Wright's stain or Wright-Giemsa, and examined by a medical laboratory scientist. The smear is examined in a systematic pattern, scanning from side to side within the feathered edge and counting cells consecutively. The differential is typically performed at 400x or 500x magnification, but 1000x magnification may be used if abnormal cells are present.[32]:10–1 Cells are identified based on their morphologic features, such as the size and structure of their nucleus and the colour and texture of their cytoplasm. This allows abnormal cell types and changes in cellular appearance to be identified.[8]:303 In most cases, the scientist counts 100 white blood cells, but 200 may be counted for better representation if the white blood cell count is high.[32]:10 The manual differential count produces percentages of each cell type, which can be multiplied by the total white blood cell count from the analyzer to derive the absolute values.[8]:329
The manual differential can be partially automated with digital microscopy software,[8]:318 which uses artificial intelligence to classify white blood cells from photomicrographs of the blood smear.[12]:44–5 However, this technique requires confirmation by manual review.[33][34]
Limitations
Because relatively few cells are counted in the manual differential, the variability is higher than in automated techniques, especially when cells are present in low amounts.[14]:182–4 For example, in a sample containing 5 percent monocytes, the manual differential results could be between 1 and 10 percent due to sampling variation.[35] Additionally, cell identification is subjective and the accuracy depends on the skills of the person reading the slide.[36][14]:194 Poor blood smear preparation can cause an uneven distribution of white blood cells, resulting in inaccurate counting,[12]:30–1 and improper staining can impede cell identification.[14]:195 Overall, manual differential counts exhibit coefficients of variation (CVs) ranging from 5 to 10 percent, while automated differential counts of normal neutrophils and lymphocytes have CVs of about 3 percent.[14]:194
In leukemias and other hematologic malignancies, the lineage and genetic characteristics of white blood cells have important implications for treatment and prognosis, and the microscopic appearance of the cells is often insufficient for accurate classification.[18]:336[37] In these cases, other techniques such as immunophenotyping by flow cytometry or special staining can be used to definitively identify the cells.[32]:9
Automated differential
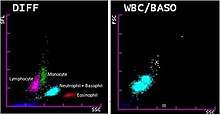
Most hematology analyzers provide a five-part differential, enumerating neutrophils, lymphocytes, monocytes, eosinophils and basophils. Some instruments can also count immature granulocytes and nucleated red blood cells.[18]:795 Hematology analyzers measure various properties of white blood cells, such as impedance, light scattering parameters, and staining reactions. This data is analyzed and plotted on a scattergram, forming distinct clusters which correspond to white blood cell types. The number of points in each cluster describes the number of cells, and the shape of the clusters can indicate changes in cellular structure.[12]:51 The analyzer counts many more cells than are counted in a manual differential, resulting in improved precision.[14]:182–4 If abnormal features or cell populations that the analyzer cannot identify are present, the instrument can flag the results for manual blood smear review.[18]:795[12]:51
Procedure
Most hematology analyzers use combinations of light scattering, Coulter counting, and cytochemical staining techniques. Some analyzers also use radiofrequency analysis and monoclonal antibody tagging to identify cells.[18]:795–803[14]:185 Staining techniques used in differential analyzers include staining of myeloperoxidase,[14]:194 an enzyme found in cells of myeloid lineage,[38] and nucleic acids, which are found in higher concentrations in immature cells.[39]
A small volume of blood (as low as 150 microliters) is aspirated into the analyzer, where reagents are applied to lyse red blood cells and preserve white blood cells. The sample is diluted and passed into a flow cell, which uses hydrodynamic focusing to isolate single cells for accurate analysis of their properties. Various cellular parameters, such as size, complexity and staining reactions, are measured and analyzed to identify cell populations. Basophils, which are difficult to differentiate from other white blood cells by routine methods, are usually quantified using a reagent that lyses the cytoplasm of other white blood cells but leaves basophils intact.[14]:184–95 Samples that have abnormal results[1] or are suspected to contain abnormal cells are flagged by the analyzer for manual blood smear review.[12]:43
To ensure that results from the automated analyzer are correct, quality control samples are run at least once per day. These are samples with known results that are most often provided by the instrument manufacturer. Laboratories compare their differential results to the known values to ensure the instrument is operating correctly. A moving average measurement may also be used, in which the average results for patient samples are measured at certain intervals. Assuming that the characteristics of the patient population remain roughly the same over time, the average should remain constant. Large shifts in the average value can indicate instrument problems.[7]:697–8[40]
Limitations
When immature or abnormal white blood cells are present, automated differential results may be incorrect, necessitating a manual blood smear review. Overall, 10 to 25 percent of CBC samples are flagged for manual review by the analyzer.[14]:194–8 While the majority of abnormal samples are automatically flagged, some are missed;[12]:43–4 conversely, analyzers may generate false positive flags when no abnormal cells are present.[14]:194 Hematology laboratories compensate for these issues by requiring a smear review when differential or CBC results fall outside certain numerical thresholds, regardless of the presence of analyzer flags.[1] The sensitivity and specificity of analyzer flagging can be determined by comparing analyzer flags to manual differential results.[40]
The automated basophil count is notoriously unreliable,[14]:196[11] often underestimating counts in basophilia and producing falsely elevated results in the presence of abnormal cells.[41] The manual differential is therefore considered the reference method for these cells.[11][42]
Analyzers may count nucleated red blood cells, giant and clumped platelets, and red blood cells containing abnormal hemoglobins (such as Hemoglobin S in sickle cell disease) as white blood cells, leading to faulty differential results. Automated differential counts on aged specimens may be incorrect due to cellular degeneration.[15]:226
White blood cell types and result interpretation
Reference ranges for the white blood cell differential are defined by individual laboratories and may vary due to different patient populations and testing methods.[37] The ranges presented here are for example purposes only.
| Cell type | Image | Description | Increase (higher count than normal) | Decrease (lower count than normal) | Adult reference range (%) (percentage of total white blood cell count) | Adult reference range (x 109/L) (absolute number of cells) [note 1] |
|---|---|---|---|---|---|---|
| Neutrophil | 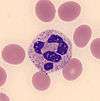 | Neutrophils are the most common white blood cells in normal adult blood. When stained with a Romanowsky stain, they exhibit a multi-lobed nucleus and pink cytoplasm that contains small purple granules.[18]:306[12]:88–93 | Neutrophilia: Acute infections, especially bacterial;[8]:306[43]:252 inflammation, physiologic stress,[8]:306 myeloproliferative disorder;[18]:308–11 normal in pregnancy and the neonatal period[43]:252 | Neutropenia: Various drugs, especially chemotherapy;[44] leukemia, myelodysplastic syndrome and other bone marrow disorders; certain infections; autoimmune and congenital disorders; may be normal in certain ethnicities[43]:247–52 | 50–70 | 1.7–7.5 |
| Lymphocyte | 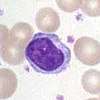 | Lymphocytes, which are the second most common type of white blood cell in adults, are typically small cells with a round, dark nucleus and a thin strip of pale blue cytoplasm. Some lymphocytes are larger and contain a few blue granules.[8]:309 | Lymphocytosis: Viral infection,[8]:309 chronic lymphocytic leukemia and other lymphoproliferative disorders,[45] splenectomy;[43]:259 normal in children[43]:259 | Lymphopenia: HIV/AIDS, influenza, viral hepatitis; protein-energy malnutrition,[46] drug reaction, various acute illnesses[43]:258–9 | 18–42 | 1.0–3.2 |
| Monocyte | 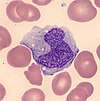 | Monocytes are large cells with a curved or folded nucleus and finely granulated, grey-blue cytoplasm that often contains vacuoles. Monocytes are the third most common white blood cell after neutrophils and lymphocytes.[8]:307 | Monocytosis: Chronic infection and inflammation, myeloproliferative disorders and monocytic leukemias;[12]:95 normal in newborns[43]:258 | Monocytopenia: Chemotherapy, aplastic anemia, severe burns, AIDS[43]:258 | 2–11 | 0.1–1.3 |
| Eosinophil | 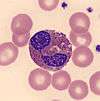 | Eosinophils have large orange granules in their cytoplasm and bi-lobed nuclei. They are found in low amounts in normal blood.[8]:307 | Eosinophilia: Parasitic infection, allergic conditions,[12]:94 asthma,[43]:256 myeloproliferative disorder[12]:94–5 | Eosinopenia: Normally found in low numbers; may be decreased during pregnancy, acute stress and inflammation, and treatment with certain drugs[43]:256 | 1–3 | 0–0.3 |
| Basophil | 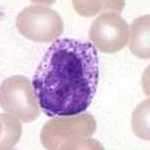 | Basophils exhibit large, dark purple granules that often cover the cell's nucleus. They are the rarest of the five normal cell types.[12]:94–5 | Basophilia: Myeloproliferative disorder[12]:94–5, splenectomy, hypersensitivity reactions[43]:257 | Basopenia: Normally found in low numbers; may be decreased during acute stress, ovulation and treatment with steroid drugs[43]:257 | 0–2 | 0–0.2 |
| Band neutrophil | 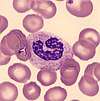 | Band neutrophils are young forms of neutrophils which lack segmentation of the nucleus. These cells, which are identified by manual counting, are found in low numbers in normal adult blood. The term left shift refers to an increase in bands or immature granulocytes.[12]:93[13]:153–4 | Left shift or bandemia: Infection, inflammation, myeloproliferative disorder; normal in pregnancy[12]:93[13]:153–4 | N/A | N/A | N/A |
| Immature granulocyte | 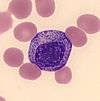 | Immature granulocytes are immature forms of neutrophils and other granulocytes (eosinophils and basophils). This classification consists of metamyelocytes, myelocytes and promyelocytes, which may be enumerated separately in the manual differential or reported together as immature granulocytes (IG) by automated methods.[12]:38 Immature granulocytes are normally found in the bone marrow, but not in peripheral blood.[47] | Left shift: Infection, inflammation, myeloproliferative disorder, steroid use, pregnancy[11][47] | Not normally found in peripheral blood[47] | N/A | N/A |
| Blast cell | 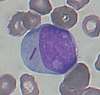 | Blast cells are very immature cells that are normally found in the bone marrow, where they develop into mature cells (haematopoiesis) before being released into the blood. They can be identified by their large overall size, deep blue cytoplasm, and large nucleus with fine chromatin and prominent nucleoli.[10] | Leukemia and other hematologic disorders; may rarely be seen in severe cases of left shift[10][48]:6–7 | Not normally found in peripheral blood[10] | N/A | N/A |
Clinical significance
- Neutrophil
- The neutrophil count is normally higher in newborns and pregnant women than in other groups.[43]:252 Outside of these conditions, increased neutrophil counts (neutrophilia) are associated with bacterial infection, inflammation, and various forms of physiological stress.[8]:306 Neutrophil counts can become extremely high in some infections and inflammatory states, which is termed leukemoid reaction because the high white blood cell count mimics leukemia.[43]:253 Neutrophilia may also occur in myeloproliferative disorders.[8]:306
Neutropenia, meaning a low neutrophil count, may occur as a response to drug treatment (especially chemotherapy)[44] or in certain infections, such as tuberculosis and Gram-negative septicemia. Neutropenia also occurs in many hematologic disorders, such as leukemia and myelodysplastic syndrome, and in a variety of autoimmune and congenital diseases.[43]:247–52 A decreased neutrophil count may be normal in individuals of certain ethnicities; this is termed benign ethnic neutropenia.[43]:8[49] Very low neutrophil counts are associated with immunosuppression.[18]:308–11
When stimulated by infection or inflammation, neutrophils may develop abnormal features in their cytoplasm, such as toxic granulation, toxic vacuolation and Döhle bodies. These features, which are caused by the release of cytokines,[50]:4 are collectively known as toxic changes.[13]:153 - Lymphocyte
- Increased lymphocyte counts (lymphocytosis) can be caused by various viral infections[8]:309 and may also occur after splenectomy. Children have higher lymphocyte counts than adults.[43]:258–9 Chronic lymphocytic leukemia presents with an elevated lymphocyte count and abnormal lymphocyte morphology, in which the lymphocytes have extremely dense, clumped nuclei[51] and some cells appear smudged on the blood smear.[45]
Low lymphocyte counts (lymphopenia) may be seen in infections such as HIV/AIDS, influenza and viral hepatitis, as well as in protein-energy malnutrition,[46] acute illnesses and drug reactions.[43]:258–9
In response to viral infections (especially infectious mononucleosis), lymphocytes may increase greatly in size, developing unusually shaped nuclei and large amounts of dark blue cytoplasm. Such cells are referred to as reactive or atypical lymphocytes[12]:95–7 and when present they are either commented on or counted separately from normal lymphocytes in the manual differential.[37]
- Monocyte
- Increased monocyte counts (monocytosis) are seen in chronic infection and inflammation. Extremely high monocyte counts, as well as immature forms of monocytes, occur in chronic myelomonocytic leukemia and acute leukemias of monocytic origin.[12]:95 Monocyte counts may be decreased (monocytopenia) in individuals who are receiving chemotherapy as well as those with aplastic anemia, severe burns, and AIDS.[43]:258
- Eosinophil
- Elevated eosinophil counts (eosinophilia) are associated with allergic reactions, parasitic infections, and asthma.[12]:94[43]:256 Eosinophil counts may be decreased in pregnancy and in response to physiological stress, inflammation or treatment with certain drugs, such as steroids and epinephrine.[43]:256
- Basophil
- Basophilia and eosinophilia can occur along with other white blood cell abnormalities in chronic myeloid leukemia and other myeloproliferative disorders.[12]:94–5 An increased basophil count may also be seen in hypersensitivity reactions and after splenectomy. The basophil count may decrease during ovulation, steroid treatment, and periods of physiological stress.[43]:257
- Band neutrophil
- A left shift, meaning an increase in band neutrophils or immature granulocytes, can indicate infection, inflammation or bone marrow disorders, although it can also be a normal finding in pregnancy.[12]:93[13]:153–4 Some laboratories do not separate bands from mature neutrophils in the differential count because the classification is highly subjective and unreliable.[37]
- Immature granulocyte
- When present in significant quantities in the blood, immature granulocytes (IGs) can indicate infection and inflammation,[11] as well as myeloproliferative disease, leukemia and other conditions affecting the marrow.[47] IGs may also be increased in steroid use and pregnancy.[11] Chronic myeloid leukemia often presents with a high number of immature granulocytes in the peripheral blood.[52] Abnormal promyelocytes with multiple Auer rods, called faggot cells, occur in acute promyelocytic leukemia.[53]
- Blast cell
- When seen on the blood smear, blast cells are an abnormal finding and may be indicative of acute leukemia or other serious blood disorders. Rarely, they may be seen in severe cases of left shift. The presence of Auer rods inside blast cells indicates that they are of myeloid origin, which has important implications for leukemia treatment.[10][48]:6–7 Other morphologic features can provide information about the lineage of blast cells: for example, myeloblasts tend to be large with distinct nucleoli, while lymphoblasts can be smaller with a denser chromatin pattern. However, these features are not diagnostic, and flow cytometry or special staining is generally used to confirm the lineage.[50]:13–22
- Others
- Various other abnormal cells may be present in the blood in certain conditions. For example, lymphoma cells may be found on the manual differential in some cases of lymphoma,[48]:228 and in mast cell leukemia, mast cells, which are normally confined to tissue, circulate in the blood.[48]:328 There is a very rare phenomenon called carcinocythemia in which tumour cells are seen on the peripheral blood smear.[54]:185
Notes
- Reference ranges from Rodak's Hematology: Clinical Principles and Applications (2015), p. 2, unless otherwise stated
See also
- Flow cytometry
- Cell counting
References
- Gulati, Gene; Song, Jinming; Dulau Florea, Alina; Gong, Jerald (2013). "Purpose and Criteria for Blood Smear Scan, Blood Smear Examination, and Blood Smear Review". Annals of Laboratory Medicine. 33 (1): 1–7. doi:10.3343/alm.2013.33.1.1. ISSN 2234-3806. PMC 3535191. PMID 23301216.
- Cornell University College of Veterinary Medicine. "Leukogram". eClinpath. Retrieved 9 August 2019.
- Lutinger, Irina (2002). "Getting the most from your laboratory information system in the hematology laboratory". Accreditation and Quality Assurance. 7 (11): 494–497. doi:10.1007/s00769-002-0539-y. ISSN 0949-1775.
- Robin S. Warekois; Richard Robinson (27 December 2013). Phlebotomy: Worktext and Procedures Manual. Elsevier Health Sciences. ISBN 978-0-323-29284-9.
- "Blood Differential: MedlinePlus Lab Test Information". MedlinePlus. Archived from the original on 12 August 2019. Retrieved 12 August 2019.
- American Association for Clinical Chemistry (1 May 2019). "WBC Differential". Lab Tests Online. Archived from the original on 14 April 2019. Retrieved 8 July 2019.
- Kandice Kottke-Marchant; Bruce Davis (6 June 2012). Laboratory Hematology Practice. John Wiley & Sons. ISBN 978-1-4443-9857-1.
- Mary Louise Turgeon (23 March 2015). Linné & Ringsrud's Clinical Laboratory Science: Concepts, Procedures, and Clinical Applications (7th ed.). Elsevier Mosby. ISBN 978-0-323-22545-8.
- Barnes, P. W.; Mcfadden, S. L.; Machin, S. J.; Simson, E. (2005). "The International Consensus Group for Hematology Review: Suggested Criteria for Action Following Automated CBC and WBC Differential Analysis". Laboratory Hematology. 11 (2): 83–90. doi:10.1532/LH96.05019. ISSN 1080-2924. PMID 16024331.
- Giuseppe d'Onofrio; Gina Zini (21 October 2014). "Acute Myeloid Leukaemia". Morphology of Blood Disorders (2nd ed.). Wiley. p. 289. ISBN 978-1-118-44258-6.
- Chabot-Richards, Devon S.; George, Tracy I. (2015). "White Blood Cell Counts". Clinics in Laboratory Medicine. 35 (1): 11–24. doi:10.1016/j.cll.2014.10.007. ISSN 0272-2712. PMID 25676369.
- Bain, Barbara (2012). Dacie and Lewis practical haematology. Edinburgh: Elsevier Churchill Livingstone. ISBN 978-0-7020-3407-7. OCLC 780445109.
- Betty Ciesla (27 November 2018). Hematology in Practice. F.A. Davis. ISBN 978-0-8036-6825-6.
- John P. Greer; Daniel A. Arber; Bertil E. Glader; Alan F. List; Robert M. Means; George M. Rodgers (19 November 2018). Wintrobe's Clinical Hematology (14th ed.). Wolters Kluwer Health. ISBN 978-1-4963-6713-6.
- Elaine Keohane; Larry Smith; Jeanine Walenga (20 February 2015). Rodak's Hematology: Clinical Principles and Applications. Elsevier Health Sciences. ISBN 978-0-323-23906-6.
- Simson, Elkin (2012). "Historical Perspective on Cellular Analysis". In Kottke-Marchant, K.; Davis, B. H. (eds.). Laboratory Hematology Practice. pp. 1–9. doi:10.1002/9781444398595.ch1. ISBN 9781444398595.
- Bezrukov, AV (2017). "Romanowsky staining, the Romanowsky effect and thoughts on the question of scientific priority". Biotechnic & Histochemistry. 92 (1): 29–35. doi:10.1080/10520295.2016.1250285. ISSN 1052-0295. PMID 28098484.
- Denise Harmening (2009). Clinical Hematology and Fundamentals of Hemostasis (5th ed.). F. A. Davis Company. ISBN 978-0-8036-1732-2.
- Graham, M (2003). "The Coulter principle: foundation of an industry". Journal of the Association for Laboratory Automation. 8 (6): 72–81. doi:10.1016/S1535-5535(03)00023-6. ISSN 1535-5535.
- Van Dilla, M. A.; Fulwyler, M. J.; Boone, I. U. (1967). "Volume Distribution and Separation of Normal Human Leucocytes". Experimental Biology and Medicine. 125 (2): 367–370. doi:10.3181/00379727-125-32093. ISSN 1535-3702. PMID 6028547.
- Sweet, Richard G. (1965). "High Frequency Recording with Electrostatically Deflected Ink Jets". Review of Scientific Instruments. 36 (2): 131–136. Bibcode:1965RScI...36..131S. doi:10.1063/1.1719502. ISSN 0034-6748.
- Melamed, Myron (2001). "Chapter 1 A brief history of flow cytometry and sorting". Methods in Cell Biology. 63 part A. Elsevier. pp. 3–17. doi:10.1016/S0091-679X(01)63005-X. ISBN 9780125441667. PMID 11060834.
- Fulwyler, M. J. (1965). "Electronic Separation of Biological Cells by Volume". Science. 150 (3698): 910–911. Bibcode:1965Sci...150..910F. doi:10.1126/science.150.3698.910. ISSN 0036-8075. PMID 5891056.
- Green, Ralph; Wachsmann-Hogiu, Sebastian (2015). "Development, History, and Future of Automated Cell Counters". Clinics in Laboratory Medicine. 35 (1): 1–10. doi:10.1016/j.cll.2014.11.003. ISSN 0272-2712. PMID 25676368.
- Hughes-Jones, N. C.; Norley, I.; Young, J. M. S.; England, J. M. (1974). "Differential white cell counts by frequency distribution analysis of cell volumes". Journal of Clinical Pathology. 27 (8): 623–625. doi:10.1136/jcp.27.8.623. ISSN 0021-9746. PMC 475415. PMID 4420188.
- J. Paul Robinson; Andrea Cossarizza (18 April 2017). Single Cell Analysis: Contemporary Research and Clinical Applications. Springer. pp. 70–73. ISBN 978-981-10-4499-1.
- Andreas A. Thaer; Manfred Sernetz; Wolfgang Goehde (1973). Fluorescence Techniques in Cell Biology. Springer Science & Business Media. pp. 79–88. ISBN 978-3-642-49204-4.
- Julius, M. H.; Masuda, T.; Herzenberg, L. A. (1972). "Demonstration That Antigen-Binding Cells Are Precursors of Antibody-Producing Cells After Purification with a Fluorescence-Activated Cell Sorter". Proceedings of the National Academy of Sciences. 69 (7): 1934–1938. Bibcode:1972PNAS...69.1934J. doi:10.1073/pnas.69.7.1934. ISSN 0027-8424. PMC 426835. PMID 4114858.
- Picot, Julien; Guerin, Coralie L.; Le Van Kim, Caroline; Boulanger, Chantal M. (2012). "Flow cytometry: retrospective, fundamentals and recent instrumentation". Cytotechnology. 64 (2): 109–130. doi:10.1007/s10616-011-9415-0. ISSN 0920-9069. PMC 3279584. PMID 22271369.
- Mansberg, H. P.; Saunders, Alex M.; Groner, W. (1974). "The Hemalog D White Cell Differential System". Journal of Histochemistry & Cytochemistry. 22 (7): 711–724. doi:10.1177/22.7.711. ISSN 0022-1554. PMID 4137312.
- Pierre, Robert V (2002). "Peripheral blood film review: the demise of the eyecount leukocyte differential". Clinics in Laboratory Medicine. 22 (1): 279–297. doi:10.1016/S0272-2712(03)00075-1. ISSN 0272-2712. PMID 11933579.
- Sa A. Wang; Robert P. Hasserjian (4 June 2018). Diagnosis of Blood and Bone Marrow Disorders. Springer. ISBN 978-3-319-20279-2.
- Kratz, Alexander; Lee, Szu‐hee; Zini, Gina; Riedl, Jurgen A.; Hur, Mina; Machin, Sam (2019). "Digital morphology analyzers in hematology: ICSH review and recommendations". International Journal of Laboratory Hematology. 41 (4): 437–447. doi:10.1111/ijlh.13042. ISSN 1751-5521. PMID 31046197.
- Da Costa, Lydie (2015). "Digital Image Analysis of Blood Cells". Clinics in Laboratory Medicine. 35 (1): 105–122. doi:10.1016/j.cll.2014.10.005. ISSN 0272-2712. PMID 25676375.
- Ruemke, C. L. (1978). "The statistically expected variability in differential leukocyte counting" (PDF). In Koepke, J. A. (ed.). Differential leukocyte counting. College of American Pathologists Conference / Aspen 1997. Skokie, Illinois: College of American Pathologists.
- Kenneth D. McClatchey (2002). "Chapter 40: Peripheral blood and bone marrow assessment". Clinical Laboratory Medicine (2nd ed.). Lippincott Williams & Wilkins. p. 809. ISBN 978-0-683-30751-1.
- Palmer, L.; Briggs, C.; McFadden, S.; Zini, G.; Burthem, J.; Rozenberg, G.; Proytcheva, M.; Machin, S. J. (2015). "ICSH recommendations for the standardization of nomenclature and grading of peripheral blood cell morphological features". International Journal of Laboratory Hematology. 37 (3): 287–303. doi:10.1111/ijlh.12327. ISSN 1751-5521. PMID 25728865.
- Faramarz Naeim; P. Nagesh Rao; Wayne W. Grody (5 March 2009). Hematopathology: Morphology, Immunophenotype, Cytogenetics, and Molecular Approaches. Academic Press. pp. 210–. ISBN 978-0-08-091948-5.
- Arneth, Borros M.; Menschikowki, Mario (2015). "Technology and New Fluorescence Flow Cytometry Parameters in Hematological Analyzers". Journal of Clinical Laboratory Analysis. 29 (3): 175–183. doi:10.1002/jcla.21747. ISSN 0887-8013. PMC 6807107. PMID 24797912.
- Vis, J. Y.; Huisman, A. (2016). "Verification and quality control of routine hematology analyzers". International Journal of Laboratory Hematology. 38: 100–109. doi:10.1111/ijlh.12503. ISSN 1751-5521. PMID 27161194.
- Buttarello, Mauro; Plebani, Mario (2008). "Automated Blood Cell Counts". American Journal of Clinical Pathology. 130 (1): 104–116. doi:10.1309/EK3C7CTDKNVPXVTN. ISSN 0002-9173. PMID 18550479.
- Gibbs, Bernhard (2014). "The absolute basophil count". Basophils and mast cells : methods and protocols. New York, NY: Humana Press. ISBN 978-1-4939-1172-1. OCLC 889943963.
- Anna Porwit; Jeffrey McCullough; Wendy N Erber (27 May 2011). Blood and Bone Marrow Pathology. Elsevier Health Sciences. ISBN 978-0-7020-4535-6.
- Ronald Hoffman; Edward J. Benz, Jr.; Leslie E. Silberstein; Helen Heslop; John Anastasi; Jeffrey Weitz (1 January 2013). Hematology: Basic Principles and Practice. Elsevier Health Sciences. p. 644. ISBN 978-1-4377-2928-3.
- Kaseb, Hatem; Taneja, Alankrita; Master, Samip (2019). "Cancer, Chronic Lymphocytic Leukemia (CLL)". StatPearls. Treasure Island, Florida: StatPearls Publishing. Retrieved 24 July 2019.
- Territo, Mary (2018). "Lymphocytopenia". Merck Manuals Professional Edition. Archived from the original on 10 October 2018. Retrieved 22 July 2019.
- Curry, Choladda Vejabhuti; Staros, Eric (14 January 2015). "Differential Blood Count". EMedicine. Archived from the original on 12 July 2019. Retrieved 17 July 2019.
- Eric F. Glassy (1998). Color Atlas of Hematology: An Illustrated Field Guide Based on Proficiency Testing. College of American Patholgists. ISBN 978-0-930304-66-9.
- Atallah-Yunes, Suheil Albert; Ready, Audrey; Newburger, Peter E. (2019). "Benign ethnic neutropenia". Blood Reviews. 37. doi:10.1016/j.blre.2019.06.003. ISSN 0268-960X. PMC 6702066. PMID 31255364.
- Hematology and Clinical Microscopy Committee (2019). "Blood cell identification" (PDF). Hematology and Clinical Microscopy Glossary. College of American Pathologists. Archived (PDF) from the original on 28 June 2019. Retrieved 28 June 2019.
- Oscier, David; Else, Monica; Matutes, Estella; Morilla, Ricardo; Strefford, Jonathan C.; Catovsky, Daniel (2016). "The morphology of CLL revisited: the clinical significance of prolymphocytes and correlations with prognostic/molecular markers in the LRF CLL4 trial". British Journal of Haematology. 174 (5): 767–775. doi:10.1111/bjh.14132. ISSN 0007-1048. PMC 4995732. PMID 27151266.
- Emadi, Ashkan; Law, Jennie (2018). "Chronic Myeloid Leukemia (CML)". Merck Manuals Professional Edition. Archived from the original on 18 August 2019. Retrieved 30 August 2019.
- Adams, Julia; Nassiri, Mehdi (2015). "Acute Promyelocytic Leukemia: A Review and Discussion of Variant Translocations". Archives of Pathology & Laboratory Medicine. 139 (10): 1308–1313. doi:10.5858/arpa.2013-0345-RS. ISSN 0003-9985. PMID 26414475.
- Irma Pereira; Tracy I. George; Daniel A. Arber (7 December 2011). "Chapter 20: Nonhematopoietic tumors in the blood". Atlas of Peripheral Blood: The Primary Diagnostic Tool. Lippincott Williams & Wilkins. ISBN 978-1-4511-6366-7.