


YOUNG WORKER SAFETY AND HEALTH
 ShareCompartir
Selected Charts on Young Worker Employment, Injuries and Illnesses
These charts include currently available data as well as trend data for multiple years.
| Chart Thumbnail Image | Description |
|---|---|
|
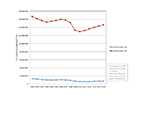
Numbers of Employed Youth FTEs (Ages 16-24) by year, United States, 2000-2015 This graph shows the numbers of full-time equivalents (FTEs) for employed youth ages 16-24 years in the United States for the time period 2000-2015. (Source: Bureau of Labor Statistics’ Current Population Survey. NIOSH analyses using public microdata files.) |
|
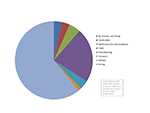
Distribution of Employed Youth FTEs (Ages 16-17) by Industry Sector, United States, 2015 This pie chart shows the distribution of full type equivalents (FTEs) for employed youth ages 16-17 years by industry sector in 2015. The industry sector with the largest numbers of employed youth was the services sector, accounting for 61% of all youth employment, mostly in restaurants and other food services. This was followed by trade sector with 23% of youth employment, then the healthcare and social assistance sector with 5% of youth employment. (Source: Bureau of Labor Statistics’ Current Population Survey. NIOSH analyses using public microdata files.) |
|
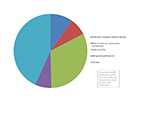
Distribution of Employed Youth FTEs (Ages 16-17) by Occupation, United States, 2015 This pie chart shows the distribution of full type equivalents (FTEs) for employed youth ages 16-17 years by occupation in 2015. Service jobs were the primary occupation for 43% of all youth employment. This was followed by sales and office occupations with 32% of youth employment. (Source: Bureau of Labor Statistics’ Current Population Survey. NIOSH analyses using public microdata files.) |
|
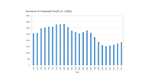
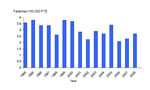
Numbers of Employed Youth (Ages 15-17) by Year, United States This graph shows the numbers of employed youth ages 15- 17 years in the United States for the time period 1992 to 2015. The numbers of employed youth began a steady decline in 2007, however, the number of employed youth has increased in recent years. (Source: Bureau of Labor Statistics’ Current Population Survey. NIOSH analyses using public microdata files.) |
|
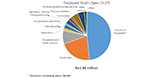
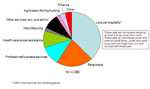
Distribution of Employed Youth (Ages 15-17) by Industry Sector, United States, 2015 This pie chart shows the distribution of employed youth ages 15-17 years by industry sector in 2015. The industry sector with the largest numbers of employed youth was the leisure and hospitality sector, accounting for 48% of all youth employment, mostly in restaurants and other food services. This was followed by the retail trade sector with 21% of youth employment, then the educational and health services sector with 9% of youth employment. (Source: Bureau of Labor Statistics’ Current Population Survey. NIOSH analyses using public microdata files.) |
|
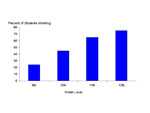
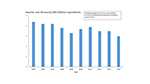
Percent Students Working by Grade Level, United States, 1997-2003 This graph shows the percent of U.S high school students working by grade level. These data for the years 1997 to 2003 demonstrate that formal youth employment steadily increases by grade level, with 24 % of 9th graders reporting formal employment, rising to 75% of 12 graders. (Source: Work activity of high school students: Data from the National Longitudinal Survey of Youth, 1997, USDL 05-732.) |
|
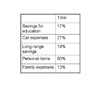
Percent of US Working High School Seniors Spending at Least Half of Their Earnings on Selected Categories, 2001 This table shows the percentage of U.S. high school seniors spending at least half of their earnings on select categories. The table shows that 60% of working high school seniors spent at least half of their earnings on personal items, followed by 27% spending at least half of their earnings on car expenses. Lesser percentages of high school seniors saved at least half of their earnings for long-range savings or education. The lowest percentage was for the category of family expenses, with 13% of high school seniors reporting spending at least half of their earnings for family expenses. (Source: US Dept. of Education, Youth Indicators, 2005. Data from Monitoring the Future Survey.) |
|
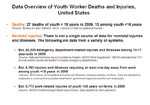
Data Overview of Young Worker Deaths and Injuries, United States Facts of young worker deaths and nonfatal injuries from different data sources. |
|
Distribution of Youth (<18 Years) Work-related Injuries and Illnesses Involving Days Away from Work Reported by Private Sector Employers by Industry Sector, United States, 2009 The pie chart shows employer-reported work-related injuries and illnesses among youth that required at least a day away from work by industry sector in 2009. The industry sector with the largest numbers of injured youth was the leisure and hospitality sector, accounting for 38% of reported injuries and illnesses among youth, with most of the injuries and illnesses in food services and drinking places. The retail trade sector had the second highest frequency with 21% of reported injuries and illnesses among youth. (Source: Bureau of Labor Statistics’ (BLS) Survey of Occupational Injuries and Illnesses. The survey excludes farms with fewer than 11 employees, the self-employed, private household workers, and federal employees. Data from state and local government employees are included in the survey, but not reported above. Data were provided by James Rice of BLS.) |
|
Fatality Rates/100,000 Fulltime Equivalents (FTE) for 15-17 Year-Olds by Year, United States This graph shows work-related injury fatality rates for 15 to 17 year olds in the United States for the time period 1994 to 2008. There is not a clear trend in these numbers, with rises and falls in youth fatality rates over the time period. The highest fatality rate, 3.8 deaths per 100,000 fulltime equivalents, was in the years 1995 and 1998. The lowest fatality rate, 2.1 deaths per 100,000 fulltime equivalents, was in 2006. The rate in 2008 was 2.7 deaths per 100,000 fulltime equivalents. (Source: Bureau of Labor Statistics’ Census of Fatal Occupational Injuries. NIOSH analysis of special research file. Rates for 1994 through 2002 exclude deaths in New York City.) |
|
Rates of Work-related Injuries and Illnesses Treated in Hospital Emergency Departments by Year, 15-17 Year-Olds, United States This graph shows rates for work-related nonfatal injuries and illnesses treated in emergency departments for 15 to 17 year olds in the United States for the time period 2005 to 2014. Rates were generally declining from 2005 to 2009, then variable for the next few years. The highest rate, 4.4 injuries and illnesses per 100 fulltime equivalents, was in 2005. The lowest rate, 3.0 injuries and illnesses per 100 fulltime equivalents, was in 2014. (Source: National Electronic Injury Surveillance System (NEISS)- NIOSH Work Supplement.) |
|
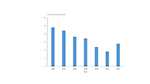
Rates of Work-Related Injuries and Illnesses Treated in Emergency Departments by Age Group, United States, 2014 This graph shows rates for work-related nonfatal injuries and illnesses treated in emergency departments by age group in the United States for 2014. The highest rate is seen for workers 18 to 24 years of age, with a rate of 3.4 injuries and illnesses per 100 fulltime equivalents. The next highest rate is seen for workers 15 to 17 years of age, with a rate of 3.0 injuries and illnesses per 100 fulltime equivalents. Rates decline for older age groups from a rate of 2.4 injuries and illnesses per 100 fulltime equivalents for workers 25 to 34 years of age to a rate of 1.3 for workers 65 years and older. (Source: National Electronic Injury Surveillance System (NEISS)- NIOSH Work Supplement.) |
|
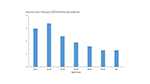
Rates of Work-related Injuries Reported by Farm Operators, 15-17 Year-Olds, United States This graph shows rates of work-related injuries among 15 to 17 year olds reported by farm operators in the United States for 7 points in time between 1998 and 2014. Rates steadily declined from a high of 9.6 injuries per 1,000 youth working on farms in 1998 to 3.7 injuries per 1,000 youth working on farms in 2012, before showing an increase in 2014 to 5.6 injuries per 1,000 youth working on farms. (Source: NIOSH Childhood Agricultural Injury Survey.) |
|
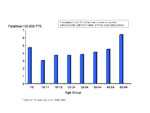
Fatality Rates/100,000 Fulltime Equivalents (FTE) by Age Group, United States, 1994-2003 This graph shows work-related injury fatality rates by age groups ranging from 15 year-olds to workers 55 to 64 years of age in the United States for the time period 1994 to 2003. The highest fatality rates are seen at the ends of this spectrum, with the highest rates for workers 55 to 64 years of age, 6.4 deaths per 100,000 fulltime equivalents, followed by the rate for 15 year olds, 4.7 deaths per 100,000 fulltime equivalents. Rates generally increase from younger to older age groups for the mediate age groups with rates increasing from a low of 3 deaths per 100,000 fulltime equivalents for 16 to 17 year-olds to a rate of 4.8 deaths per 100,000 fulltime equivalents for workers 45-54 years of age. (Source: Bureau of Labor Statistics- Census of Fatal Occupational Injuries. Reported in Monthly Labor Review, October 2005, by Windau and Meyer.) [PDF – 101 KB] |
- Page last reviewed: April 11, 2017
- Page last updated: April 11, 2017
- Content source:
- National Institute for Occupational Safety and Health Division of Safety Research