


YOUNG WORKER SAFETY AND HEALTH
 ShareCompartir
Charts on Young Worker Employment, Injuries and Illnesses
Selected Charts on Young Worker Employment, Injuries and Illnesses
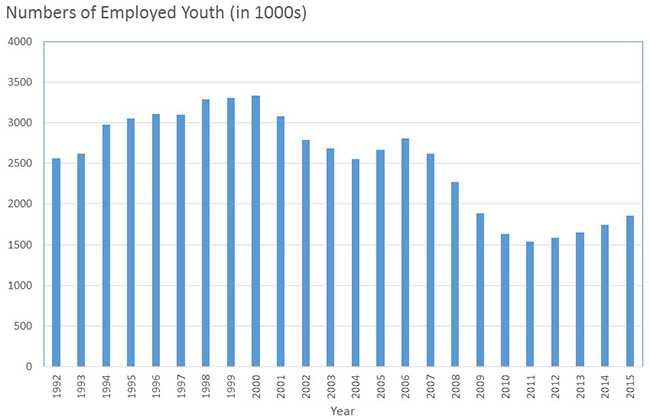
Numbers of Employed Youth (Ages 15-17) by Year, United States
This graph shows the numbers of employed youth ages 15- 17 years in the United States for the time period 1992 to 2015. The numbers of employed youth began a steady decline in 2007, however, the number of employed youth has increased in recent years. (Source: Bureau of Labor Statistics’ Current Population Survey. NIOSH analyses using public microdata files.)
Download data in Excel format Download image file in PDF format
- Page last reviewed: April 11, 2017
- Page last updated: April 11, 2017
- Content source:
- National Institute for Occupational Safety and Health Division of Safety Research