


YOUNG WORKER SAFETY AND HEALTH
 ShareCompartir
Charts on Young Worker Employment, Injuries and Illnesses
Selected Charts on Young Worker Employment, Injuries and Illnesses
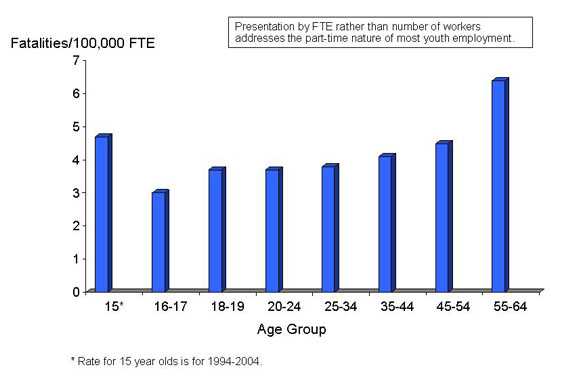
Fatality Rates/100,000 Fulltime Equivalents (FTE) by Age Group, United States, 1994-2003
This graph shows work-related injury fatality rates by age groups ranging from 15 year-olds to workers 55 to 64 years of age in the United States for the time period 1994 to 2003. The highest fatality rates are seen at the ends of this spectrum, with the highest rates for workers 55 to 64 years of age, 6.4 deaths per 100,000 fulltime equivalents, followed by the rate for 15 year olds, 4.7 deaths per 100,000 fulltime equivalents. Rates generally increase from younger to older age groups for the mediate age groups with rates increasing from a low of 3 deaths per 100,000 fulltime equivalents for 16 to 17 year-olds to a rate of 4.8 deaths per 100,000 fulltime equivalents for workers 45-54 years of age. (Source: Bureau of Labor Statistics’ Census of Fatal Occupational Injuries. Reported in Monthly Labor Review, October 2005, by Windau and Meyer.) [PDF – 101 KB]
Download data in Excel format Download image file in PDF format
- Page last reviewed: April 11, 2017
- Page last updated: March 12, 2009
- Content source:
- National Institute for Occupational Safety and Health Division of Safety Research