


YOUNG WORKER SAFETY AND HEALTH
 ShareCompartir
Charts on Young Worker Employment, Injuries and Illnesses
Selected Charts on Young Worker Employment, Injuries and Illnesses
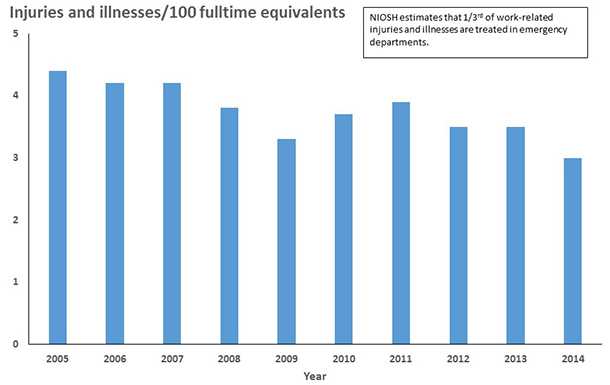
Rates of Work-related Injuries and Illnesses Treated in Hospital Emergency Departments by Year, 15-17 Year-Olds, United States
This graph shows rates for work-related nonfatal injuries and illnesses treated in emergency departments for 15 to 17 year olds in the United States for the time period 2005 to 2014. Rates were generally declining from 2005 to 2009, then variable for the next few years. The highest rate, 4.4 injuries and illnesses per 100 fulltime equivalents, was in 2005. The lowest rate, 3.0 injuries and illnesses per 100 fulltime equivalents, was in 2014. (Source: National Electronic Injury Surveillance System (NEISS)- NIOSH Work Supplement.)
Download data in Excel format Download image file in PDF format
- Page last reviewed: April 11, 2017
- Page last updated: April 11, 2017
- Content source:
- National Institute for Occupational Safety and Health Division of Safety Research