


YOUNG WORKER SAFETY AND HEALTH
 ShareCompartir
Charts on Young Worker Employment, Injuries and Illnesses
Selected Charts on Young Worker Employment, Injuries and Illnesses
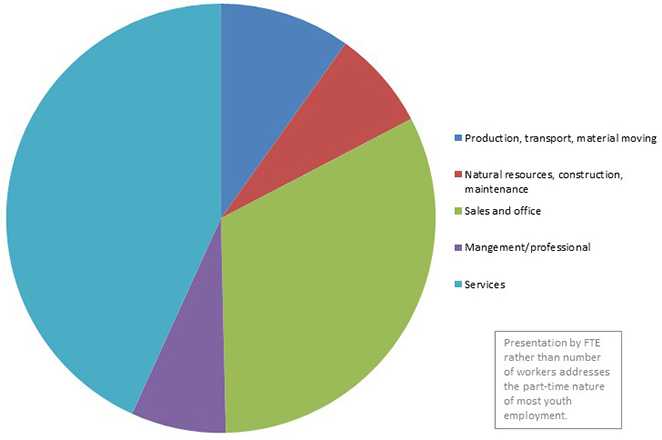
Distribution of Employed Youth FTEs (Ages 16-17) by Occupation, United States, 2015
This pie chart shows the distribution of full type equivalents (FTEs) for employed youth ages 16-17 years by occupation in 2015. Service jobs were the primary occupation for 43% of all youth employment. This was followed by sales and office occupations with 32% of youth employment. (Source: Bureau of Labor Statistics’ Current Population Survey. NIOSH analyses using public microdata files.)
Download data in Excel format Download image file in PDF format
- Page last reviewed: April 11, 2017
- Page last updated: April 11, 2017
- Content source:
- National Institute for Occupational Safety and Health Division of Safety Research