


YOUNG WORKER SAFETY AND HEALTH
 ShareCompartir
Charts on Young Worker Employment, Injuries and Illnesses
Selected Charts on Young Worker Employment, Injuries and Illnesses
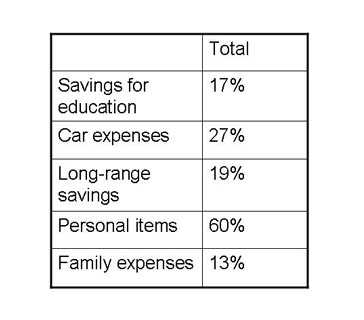
Percent of US Working High School Seniors Spending at Least Half of Their Earnings on Selected Categories, 2001
This table shows the percentage of U.S. high school seniors spending at least half of their earnings on select categories. The table shows that 60% of working high school seniors spent at least half of their earnings on personal items, followed by 27% spending at least half of their earnings on car expenses. Lesser percentages of high school seniors saved at least half of their earnings for long-range savings or education. The lowest percentage was for the category of family expenses, with 13% of high school seniors reporting spending at least half of their earnings for family expenses. (Source: US Dept. of Education, Youth Indicators, 2005. Data from Monitoring the Future Survey.)
- Page last reviewed: April 11, 2017
- Page last updated: December 9, 2014
- Content source:
- National Institute for Occupational Safety and Health Division of Safety Research