


YOUNG WORKER SAFETY AND HEALTH
 ShareCompartir
Charts on Young Worker Employment, Injuries and Illnesses
Selected Charts on Young Worker Employment, Injuries and Illnesses
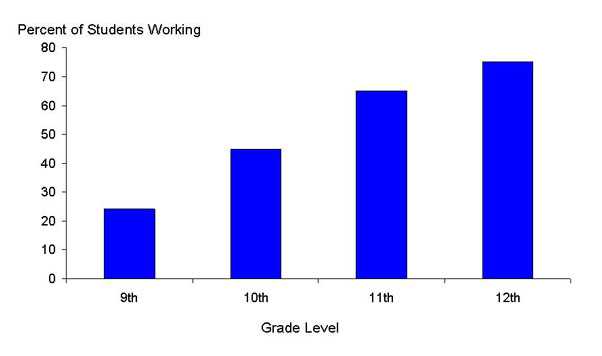
Percent Students Working by Grade Level, United States, 1997-2003
This graph shows the percent of U.S high school students working by grade level. These data for the years 1997 to 2003 demonstrate that formal youth employment steadily increases by grade level, with 24 % of 9th graders reporting formal employment, rising to 75% of 12 graders. (Source: Work activity of high school students: Data from the National Longitudinal Survey of Youth, 1997, USDL 05-732.)
Download data in Excel format Download image file in PDF format
- Page last reviewed: April 11, 2017
- Page last updated: March 12, 2009
- Content source:
- National Institute for Occupational Safety and Health Division of Safety Research