


YOUNG WORKER SAFETY AND HEALTH
 ShareCompartir
Charts on Young Worker Employment, Injuries and Illnesses
Selected Charts on Young Worker Employment, Injuries and Illnesses
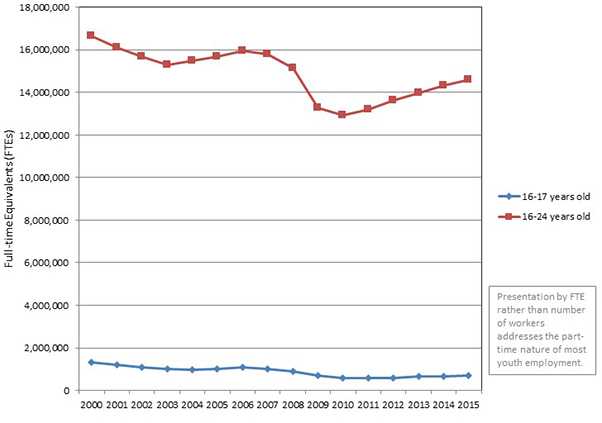
Numbers of Employed Youth FTEs (Ages 16-24) by year, United States, 2000-2015
This graph shows the numbers of full-time equivalents (FTEs) for employed youth ages 16-24 years in the United States for the time period 2000-2015. (Source: Bureau of Labor Statistics’ Current Population Survey. NIOSH analyses using public microdata files.)
Download data in Excel format Download image file in PDF format
- Page last reviewed: April 11, 2017
- Page last updated: April 11, 2017
- Content source:
- National Institute for Occupational Safety and Health Division of Safety Research