


YOUNG WORKER SAFETY AND HEALTH
 ShareCompartir
Charts on Young Worker Employment, Injuries and Illnesses
Selected Charts on Young Worker Employment, Injuries and Illnesses
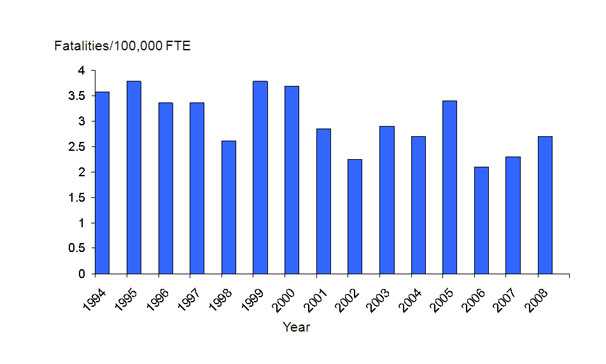
Fatality Rates/100,000 Fulltime Equivalents (FTE) for 15-17 Year-Olds by Year, United States
This graph shows work-related injury fatality rates for 15 to 17 year olds in the United States for the time period 1994 to 2008. There is not a clear trend in these numbers, with rises and falls in youth fatality rates over the time period. The highest fatality rate, 3.8 deaths per 100,000 fulltime equivalents, was in the years 1995 and 1998. The lowest fatality rate, 2.1 deaths per 100,000 fulltime equivalents, was in 2006. The rate in 2008 was 2.7 deaths per 100,000 fulltime equivalents. (Source: Bureau of Labor Statistics’ Census of Fatal Occupational Injuries. NIOSH analysis of special research file. Rates for 1994 through 2002 exclude deaths in New York City.)
Download data in Excel format Download image file in PDF format
- Page last reviewed: April 11, 2017
- Page last updated: May 25, 2011
- Content source:
- National Institute for Occupational Safety and Health Division of Safety Research