


YOUNG WORKER SAFETY AND HEALTH
 ShareCompartir
Charts on Young Worker Employment, Injuries and Illnesses
Selected Charts on Young Worker Employment, Injuries and Illnesses
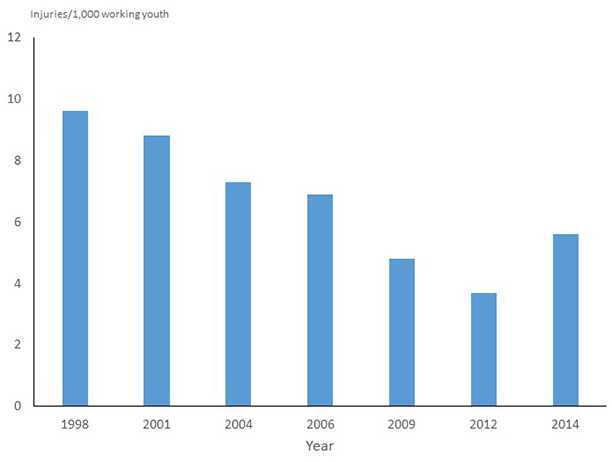
Rates of Work-related Injuries Reported by Farm Operators, 15-17 Year-Olds, United States
This graph shows rates of work-related injuries among 15 to 17 year olds reported by farm operators in the United States for 7 points in time between 1998 and 2014. Rates steadily declined from a high of 9.6 injuries per 1,000 youth working on farms in 1998 to 3.7 injuries per 1,000 youth working on farms in 2012, before showing an increase in 2014 to 5.6 injuries per 1,000 youth working on farms. (Source: NIOSH Childhood Agricultural Injury Survey.)
Download data in Excel format Download image file in PDF format
- Page last reviewed: April 11, 2017
- Page last updated: April 11, 2017
- Content source:
- National Institute for Occupational Safety and Health Division of Safety Research