

Estimated Influenza Illnesses and Hospitalizations Averted by Vaccination — United States, 2014–15 Influenza Season
 ShareCompartir
On This Page
- Table 1. Estimated number and fraction of influenza cases averted by vaccination, by age group – United States, 2014-15 influenza season.
- Table 2. Estimated influenza disease burden, by age group – United States, 2014-15 influenza season
- How does CDC estimate the number of hospitalizations, illnesses and medically-attended illnesses associated with influenza that occurred in the United States?
- Table 3: Data to estimate the number of hospitalizations, illnesses and medically-attended illnesses associated with influenza in the United States during the 2014-15 influenza season
- How does CDC estimate the number of influenza-associated outcomes that were prevented with influenza vaccination?
- Table 4. Vaccine coverage and vaccine effectiveness to estimate influenza cases averted by vaccination, by age group –2014-15 influenza season.
- How does this season compare with previous seasons?
- Table 5. Estimated influenza disease burden, by season, 2010-11 through 2014-15 influenza seasons.
- Table 6. Estimated number and fraction of influenza cases averted by vaccination, by season – United States, 2010-11 through 2014-15 influenza seasons.
- References
- Infographic: Benefits of Flu Vaccination
The most recent estimates on the impact of annual influenza vaccination and the burden of influenza in the United States are available here. Note that estimates on this page may have been updated subsequently.
December 10, 2015 — For the past few years, CDC has used a model to estimate the impact of annual influenza vaccination (1,2,3). The methods used have been described in detail previously and are outlined briefly at the bottom of this page.
For the 2014–15 influenza season, CDC used updated estimates of influenza vaccination coverage (33.4% to 69.9%, depending on age group), vaccine effectiveness (10% to 74%, depending on age group and time of season), and influenza hospitalizations rates (ranging from 35.2 per 100,000 to 1,639 per 100,000, depending on age group). Based on these methods, CDC estimates that influenza vaccination prevented approximately 67,000 influenza-associated hospitalizations, or 6.5% of potential influenza-associated hospitalizations. In addition, influenza vaccination prevented an estimated 1.9 million illnesses and 966,000 medical visits associated with influenza (see Table 1).
These estimates of averted disease burden are lower compared with previous seasons because of the reduced vaccine effectiveness of the 2014-15 influenza vaccine against the predominant circulating influenza A/H3N2 viruses. In the past the fraction of flu hospitalizations prevented by vaccination has ranged from 9% to 22%. However, a 6.5% overall reduction in flu-associated hospitalizations still represents a sizeable number of prevented influenza-associated hospitalizations during the 2014–15 season, which had a relatively high burden of severe disease, particularly among people 65 and older. During 2014-15, influenza activity peaked in late December and the influenza A/H3N2 viruses predominated in the United States (4). The overall burden of influenza disease estimated across all age groups last season was 40 million flu illnesses, 19 million flu-associated medical visits, and 970,000 flu-associated hospitalizations (see Table 2). Rates of influenza-associated hospitalizations among people 65 and older were much higher than previous seasons resulting in an estimated 8.3 million illnesses, 4.7 million medical visits and 758,000 flu hospitalizations among people in that age group last season.
Approximately three quarters of the 2014–15 estimated hospitalizations (Table 2) occurred among adults aged ≥65 years. In many years >90% of influenza deaths also occur among persons ≥65 years of age (5,6). Influenza vaccine coverage is relatively high in this vulnerable population (66% during the 2014-15 season). Therefore, further gains in preventing severe outcomes in this age group will largely require vaccines with better effectiveness. Nonetheless, persons aged ≥65 years accounted for 87% of all estimated hospitalizations prevented during 2014-2015.
The lowest prevented fraction of hospitalizations averted was among adults aged 18–49 years (3%), in part because this age group had the lowest uptake of influenza vaccination (33%). Only about one third of adults aged 18 through 49 years in the United States are vaccinated each season despite a recommendation for universal influenza vaccination for persons aged ≥6 months (7). Adults younger than 65 years make up approximately 60% of the U.S. population and during the 2014-15 season accounted for 54% of estimated influenza illnesses and 18% of hospitalizations (Table 2). This low vaccination coverage among this sizeable population means that this group has the most potential gains from improved vaccine coverage. Strategies to improve coverage include ensuring that all those who visit a health care provider during the influenza season receive an influenza vaccination recommendation and offer from their provider, using patient reminder/recall systems aided by immunization information systems, and expanding access through use of nontraditional settings for vaccination (e.g., pharmacies, workplaces, and schools) to reach persons who might not visit a physician’s office during the influenza season.
These influenza burden and averted burden estimates are subject to several limitations. First, influenza vaccination coverage estimates were derived from reports by survey respondents, not vaccination records, and are subject to recall bias. Furthermore, these estimates are based on telephone surveys with relatively low response rates; although weighting adjustments were designed to improve representativeness of the sample, they might not completely eliminate nonresponse bias. Estimates of the number of persons vaccinated based on these survey data have exceeded the actual number of doses distributed, indicating that coverage estimates used in this report might overestimate the numbers of illnesses and hospitalizations averted by vaccination. Second, this model only calculates outcomes directly averted among persons who were vaccinated. If there is indirect protection from decreased exposure of unvaccinated persons to infectious persons in a partially vaccinated population (i.e., herd immunity), the model would underestimate the number of illnesses and hospitalizations prevented by vaccination. Third, vaccine effectiveness among adults aged ≥65 years might continue to decrease with age, reaching very low levels among the oldest adults with the highest rates of influenza vaccination; thus, the model might have overestimated the effect in this group.
Conclusion
Despite reduced vaccine effectiveness last season, influenza vaccination prevented substantial influenza disease in the United States, including an estimated 966,000 medical visits and 67,000 flu hospitalizations. Although vaccines with increased effectiveness are needed, much can be done to maximize influenza prevention during the current season. In particular, efforts to increase vaccination coverage will further reduce the burden of influenza, especially among adults younger than 65 years, who continue to have the lowest influenza vaccination coverage. Although the timing and intensity of influenza virus circulation for the 2015–16 season cannot be predicted, peak weeks of influenza activity have occurred in January through March during more than 75% of seasons over the past 30 years, and significant circulation of influenza viruses can occur as late as May. Therefore, vaccination should be offered now and as long as influenza viruses continue to circulate.
Additional information related to the 2014-2015 season burden and burden averted estimates is available in a CDC spotlight report.
Top of PageTables
Table 1. Estimated number and fraction of influenza cases averted by vaccination, by age group – United States, 2014-15 influenza season.
|
Age (yrs) |
Averted cases |
Averted medically-attended cases |
Averted hospitalizations |
Fraction hospitalizations |
||||
|---|---|---|---|---|---|---|---|---|
|
No. |
(95% CI) |
No. |
(95% CI) |
No. |
(95% CI) |
% |
(95% CI) |
|
|
6 mo – 4 |
143,118 |
69,793-237,551 |
95,889 |
46,525–159,450 |
998 |
487–1,656 |
6.1% |
3.2–9.2% |
|
5–17 |
359,203 |
172,637-623,309 |
186,785 |
89,260–324,450 |
985 |
473-1,709 |
5.0% |
2.6–7.8% |
|
18–49 |
354,298 |
151,365-601,697 |
131,090 |
56,555–221,897 |
1,989 |
850-3,377 |
2.9% |
1.3–4.6% |
|
50–64 |
453,934 |
189,713-803,428 |
195,191 |
82,147-342,176 |
4,814 |
2,012-8,520 |
4.2% |
1.9–6.9% |
|
≥65 |
637,892 |
123,662-2,115,597 |
357,220 |
69,905–1,188,338 |
57,990 |
11,242-192,327 |
7.1% |
1.3–19.2% |
|
All ages |
1,948,445 |
707,170–4,381,581 |
966,176 |
344,393–2,236,311 |
66,775 |
15,063–207,590 |
6.5% |
2.0–16.4% |
Table 2. Estimated influenza disease burden, by age group – United States, 2014-15 influenza season
| Age (yrs) |
Total population |
Hospitalization rate |
Estimated cases |
Estimated medically |
Estimated hospitalizations |
|||
|---|---|---|---|---|---|---|---|---|
|
(per 100,000) |
No. |
(95% CI) |
No. |
(95% CI) |
No. |
(95% CI) |
||
|
<5 years |
19,876,883 |
111.3 |
3,173,121 |
2,780,271–3,706,666 |
2,125,991 |
1,838,700–2,508,686 |
22,122 |
19,383–25,841 |
|
5–17 years |
53,706,735 |
35.2 |
6,891,836 |
5,987,557–8,060,035 |
3,583,755 |
3,099,550–4,195,348 |
18,897 |
16,417–22,100 |
|
18–49 years |
136,381,837 |
48.1 |
11,680,240 |
10,341,654–13,694,171 |
4,321,689 |
3,765,854–5,108,070 |
65,561 |
58,048–76,866 |
|
50-64 years |
62,648,390 |
175.3 |
10,354,222 |
9,125,027–12,193,733 |
4,452,316 |
3,827,334–5,283,506 |
109,804 |
96,768–129,311 |
|
≥65 years |
46,243,211 |
1,638.8 |
8,336,054 |
7,361,607–10,116,063 |
4,668,190 |
4,065,973–5,714,484 |
757,823 |
669,237–919,642 |
|
All ages |
318,857,056 |
305.5 |
40,435,474 |
35,596,116–47,770,668 |
19,151,941 |
16,597,410–22,810,095 |
974,206 |
859,853–1,173,760 |
How does CDC estimate the number of hospitalizations, illnesses and medically-attended illnesses associated with influenza that occurred in the United States?
Laboratory-confirmed influenza-associated hospitalization rates by age group were obtained from FluSurv-NET, a collaboration between CDC, the Emerging Infections Program Network, and selected state and local health departments in 13 geographically distributed areas in the United States that conduct population-based surveillance. Reported hospitalization rates were adjusted using a multiplier to correct for underreporting, which is calculated from the percent of persons hospitalized with respiratory illness who were tested for influenza and the average sensitivity of influenza testing in surveillance hospitals. These values were measured from data collected during four post-pandemic seasons; data from 2 seasons were previously reported (8).
Adjusted rates were applied to the U.S. population by age group to calculate the numbers of influenza-associated hospitalizations. The numbers of influenza illnesses were then estimated from hospitalizations based on previously measured ratios that reflect the estimated number of ill persons per hospitalization in each age group (3).
The numbers of persons seeking medical care for influenza were then calculated using age group-specific data on the percentages of persons with a respiratory illness who sought medical care, which were estimated from results of the 2010 Behavioral Risk Factor Surveillance Survey (9).
Top of PageTable 3: Data to estimate the number of hospitalizations, illnesses and medically-attended illnesses associated with influenza in the United States during the 2014-15 influenza season
|
Age group |
Under-detection (8) |
Ratio of cases per |
Care-seeking fraction (9) |
||
|---|---|---|---|---|---|
|
Multiplier |
Influenza testing rate |
Average sensitivity of |
|||
|
% (95% CI) |
% (95% CI) |
% (95% CI) |
|||
|
6 months – 4 years |
1.9 (1.7-2.3) |
64.7 (56.3-73.1) |
79.6 (72.1-87.1) |
143.4 |
67 (64-70) |
|
5–17 years |
2.1 (1.8-2.5) |
58.4 (51.2-65.5) |
80.8 (72.5-89.1) |
364.7 |
52 (50-55) |
|
18–49 years |
2.7 (2.2-3.3) |
46.9 (39.7-54.1) |
80.3 (71.7-89.0) |
178.2 |
37 (35-40) |
|
50-64 years |
3.3 (2.7-4.1) |
38.5 (31.8-45.2) |
79.2 (69.8-88.5) |
94.3 |
43 (40-46) |
|
≥65 years |
5.3 (4.1-7.6) |
33.4 (27.6-39.2) |
56.4 (42.4-70.4) |
11.0 |
56 (53-60) |
How does CDC estimate the number of influenza-associated outcomes that were prevented with influenza vaccination?
The annual estimates of influenza vaccination coverage by month during each season, and the final end-of-season vaccine effectiveness measurements were used to estimate how many persons were not protected by vaccination during the season and thus were at risk for these outcomes. Influenza activity in this season was comprised of mostly H3N2 viruses until late February, and B/Yamagata viruses afterward. Type/subtype-specific VE varied substantially, so the VE estimate against H3N2 viruses was used in the model from August-February and the VE estimate against B/Yamagata viruses was used from March-April (Table 4).
The rate of each outcome among persons at risk was then used to estimate the number of influenza-associated outcomes that would have been expected in the same population if no one had been protected by vaccination. Finally, the averted outcomes attributable to vaccination were calculated as the difference between outcomes in the hypothetical unvaccinated population and the observed vaccinated population.
Estimates of 2014–15 influenza vaccination coverage by month from July 2014 through May 2015, were based on self-report or parental report of vaccination status using data from the National Immunization Survey for children aged 6 months–17 years and Behavioral Risk Factor Surveillance Survey data for adults aged ≥18 years (10).
Vaccine effectiveness estimates for the 2014–15 season were derived from the U.S. Influenza Vaccine Effectiveness Network, a group of five academic institutions that conduct annual vaccine effectiveness studies (11). The network estimates the effectiveness of vaccination for preventing real-time reverse transcription polymerase chain reaction–positive influenza among persons with acute respiratory illness of ≤7 days duration seen in hospitals, emergency departments, or outpatient clinics in communities in four states.
Calculations were stratified by month of the year to account for annual variations in the timing of disease and vaccination and then summed across the whole season. The prevented fraction was calculated as the number of averted illnesses divided by the total illnesses that would have been expected in an unvaccinated population.
Top of PageTable 4. Vaccine coverage and vaccine effectiveness to estimate influenza cases averted by vaccination, by age group –2014-15 influenza season.
|
Age group |
Vaccine coverage (10) |
Vaccine effectiveness (11) |
|
|---|---|---|---|
|
% |
% |
(95% CI) |
|
|
6 months – 4 years |
69.9% |
10%, H3N2
51%, B/Yamagata |
0–20%, H3N2
37–62%, B/Yamagata |
|
5–17 years |
55.7% |
10%, H3N2
51%, B/Yamagata |
0–20%, H3N2
37–62%, B/Yamagata |
|
18–49 years |
33.4% |
10%, H3N2
51%, B/Yamagata |
0–20%, H3N2
37–62%, B/Yamagata |
|
50-64 years |
46.8% |
10%, H3N2
51%, B/Yamagata |
0–20%, H3N2
37–62%, B/Yamagata |
|
≥65 years |
66.0% |
12%, H3N2
74%, B/Yamagata |
0–40%, H3N2
45–87%, B/Yamagata |
How does this season compare with previous seasons?
The tables below are presented for comparison, and show estimates made using the same method with influenza disease burden, vaccine coverage, and vaccine effectiveness values specific to each season.
Table 5. Estimated influenza disease burden, by season, 2010-11 through 2014-15 influenza seasons.
|
Season |
Hospitalization rate |
Estimated hospitalizations |
Estimated medically attended cases |
Estimated cases |
|||
|---|---|---|---|---|---|---|---|
|
(per 100,000) |
No. |
(95% CI) |
No. |
(95% CI) |
No. |
(95% CI) |
|
|
2010-11 |
86.0 |
265,621 |
225,094–355,176 |
9,192,610 |
7,594,511–12,015,633 |
19,452,269 |
16,264,389–25,292,825 |
|
2011-12 |
38.8 |
120,926 |
99,640–168,008 |
3,620,047 |
2,865,728–4,999,539 |
7,772,097 |
6,143,721–10,771,618 |
|
2012-13 |
194.5 |
610,602 |
522,315–776,030 |
16,965,722 |
14,003,742–22,067,385 |
36,390,590 |
30,387,707–46,795,694 |
|
2013-14 |
131.8 |
416,571 |
365,211–498,777 |
14,542,399 |
12,493,156–17,278,425 |
32,799,254 |
28,576,514–38,489,680 |
|
2014-15 |
305.5 |
974,206 |
859,853–1,173,760 |
19,151,941 |
16,597,410–22,810,095 |
40,435,474 |
35,596,116–47,770,668 |
Table 6. Estimated number and fraction of influenza cases averted by vaccination, by season – United States, 2010-11 through 2014-15 influenza seasons.
|
Season |
Averted cases |
Averted medically-attended cases |
Averted hospitalizations |
Fraction prevented |
||||
|---|---|---|---|---|---|---|---|---|
|
No. |
(95% CI) |
No. |
(95% CI) |
No. |
(95% CI) |
% |
(95% CI) |
|
|
2010-11 |
4,648,622 |
3,184,064–7,103,814 |
2,323,202 |
1,584,044–3,586,098 |
66,912 |
32,274–137,259 |
20.5% |
13.0–30.7% |
|
2011-12 |
1,657,570 |
964,345–2,899,257 |
811,883 |
463,777–1,436,582 |
34,122 |
14,773–73,778 |
22.3% |
13.0–33.9% |
|
2012-13 |
5,686,562 |
4,221,261–8,725,742 |
2,725,853 |
1,981,642–4,295,665 |
62,292 |
31,169–169,364 |
9.4% |
6.0–19.7% |
|
2013-14 |
7,783,453 |
5,833,060–10,485,754 |
3,580,366 |
2,603,162–4,919,044 |
114,193 |
73,066–175,244 |
21.8% |
16.9–27.0% |
|
2014-15 |
1,948,445 |
707,170–4,381,581 |
966,176 |
344,393–2,236,311 |
66,775 |
15,063–207,590 |
6.5% |
2.0–16.4% |
References
- Kostova D, Reed C, Finelli L, et al. Influenza illness and hospitalizations averted by influenza vaccination in the United States, 2005–2011. PloS One 2013; 8:e66312.
- CDC. Estimated influenza illnesses and hospitalizations averted by influenza vaccination—United States, 2012–13 influenza season. MMWR Morb Mortal Wkly Rep 2013; 62:997–1000.
- CDC. Estimated influenza illnesses and hospitalizations averted by influenza vaccination—United States, 2013–14 influenza season. MMWR Morb Mortal Wkly Rep 2014; 63:1151–1154.
- CDC. Influenza Activity — United States, 2014–15 Season and Composition of the 2015–16 Influenza Vaccine. MMWR Morb Mortal Wkly Rep 2015; 64:583-590.
- CDC. Estimates of deaths associated with seasonal influenza—United States, 1976–2007. MMWR Morb Mortal Wkly Rep 2010;59:1057–62.
- Foppa IM, Cheng PY, Reynolds SB, et al. Deaths averted by influenza vaccination in the U.S. during the seasons 2005/06 through 2013/14. Vaccine. 2015; 33:3003-9.
- CDC. Prevention and control of seasonal influenza with vaccines. Recommendations of the Advisory Committee on Immunization Practices, United States, 2015-16 influenza season. MMWR Morb Mortal Wkly Rep 2015; 64:818-825.
- Reed C, Chaves SS, Daily Kirley P, et al. Estimating influenza disease burden from population-based surveillance data in the United States. PLoS One. 2015; 10:e0118369.
- Biggerstaff M, Jhung M, Kamimoto L, et al. Self-reported influenza-like illness and receipt of influenza antiviral drugs during the 2009 pandemic, United States, 2009-2010. Am J Public Health. 2012; 102:e21-6.
- Annual estimates of influenza vaccination coverage in the United States can be viewed at Flu Vaccination Coverage, United States, 2014-15 Influenza Season. Methods for estimating season-specific influenza vaccination coverage and descriptions of National Immunization Survey and Behavioral Risk Factor Surveillance Survey data are available at Surveillance of Influenza Vaccination Coverage — United States, 2007–08 Through 2011–12 Influenza Seasons [934 KB, 32 pages].
- Flannery B, Clippard J. End of Season influenza vaccine effectiveness estimates for the 2014-15 season: Flu VE Network. Advisory Committee on Immunization Practices meeting, Atlanta Georgia, June 24-15, 2015. End-of-season influenza vaccine effectiveness estimates for the 2014-15 season: US Influenza Vaccine Effectiveness (Flu VE) Network
Benefits of Flu Vaccination
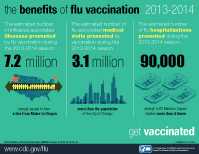 Benefits of Flu Vaccination [826 KB, 1 page]
New! GIF Images:
“City Population” 675×276 [23 KB]
“Stadium” 675×276 [23 KB]
“Stadium Small” 328×184 [10 KB]
- Page last reviewed: December 10, 2015
- Page last updated: February 17, 2017
- Content source:
- Centers for Disease Control and Prevention, National Center for Immunization and Respiratory Diseases (NCIRD)
- Page maintained by: Office of the Associate Director for Communication, Digital Media Branch, Division of Public Affairs