

Situation Update: Summary of Weekly FluView Report
 ShareCompartir
U.S. Situation Update
FluView Activity Update (Key Flu Indicators)
According to the first FluView report for the 2017-2018 season, seasonal influenza activity is low overall across the United States. Two states reported local influenza activity and 38 states and the District of Columbia reported sporadic influenza activity. Flu vaccine is the best available way to protect against influenza. CDC recommends that everyone 6 months and older get an injectable flu vaccine before the end of October, if possible. Below is a summary of the key flu indicators for the week ending October 7, 2017:
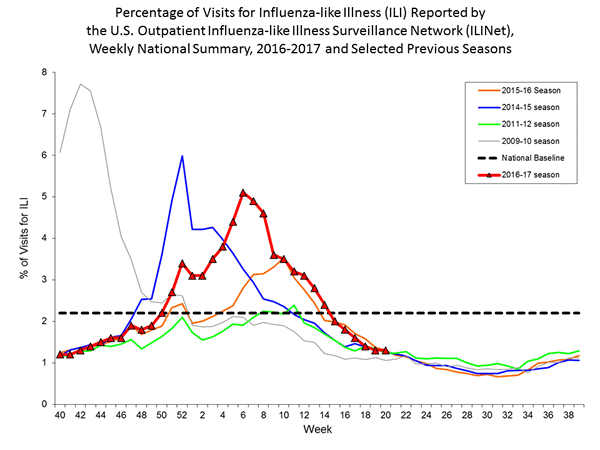
- Influenza-like Illness Surveillance: For the week ending October 7, the proportion of people seeing their health care provider for influenza-like illness (ILI) was 1.4% and is below the national baseline of 2.2%. All 10 regions reported a proportion of outpatient visits for ILI below their region-specific baseline levels. Additional ILINet data, including national, regional, and select state-level data for the current and previous seasons, can be found at http://gis.cdc.gov/grasp/fluview/fluportaldashboard.html.
- Influenza-like Illness State Activity Indicator Map: New York City, the District of Columbia, and all 50 states experienced minimal ILI activity. Data were insufficient to calculate an ILI activity level from Puerto Rico. Additional data, including data for previous seasons, can be found at https://gis.cdc.gov/grasp/fluview/main.html.
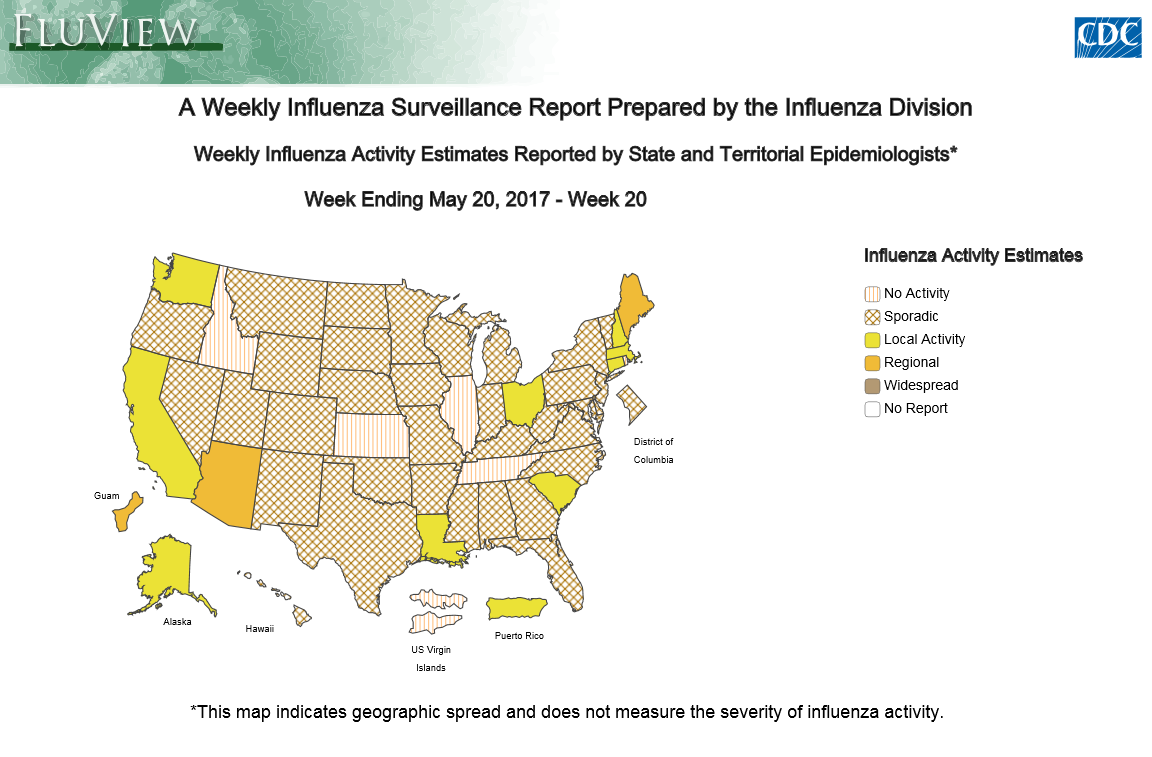
- Geographic Spread of Influenza Viruses: Guam reported widespread geographic influenza activity. Local influenza activity was reported by 2 states (Colorado and South Carolina). Sporadic activity was reported by the District of Columbia and 38 states (Alaska, Alabama, Arizona, Arkansas, California, Connecticut, Florida, Georgia, Hawaii, Idaho, Illinois, Indiana, Iowa, Kentucky, Louisiana, Maine, Massachusetts, Michigan, Minnesota, Mississippi, Missouri, Montana, New Jersey, New Mexico, New York, North Carolina, North Dakota, Ohio, Oklahoma, Oregon, Pennsylvania, South Dakota, Texas, Utah, Virginia, Washington, Wisconsin, and Wyoming). No influenza activity was reported by the 10 states (Delaware, Kansas, Maryland, Nebraska, Nevada, New Hampshire, Rhode Island, Tennessee, Vermont, and West Virginia). Puerto Rico and the U.S. Virgin Islands did not report.Geographic spread data show how many areas within a state or territory are seeing flu activity. Additional data are available at: https://gis.cdc.gov/grasp/fluview/FluView8.html.
-
Flu-Associated Hospitalizations:
- Reporting of influenza-associated hospitalization data from the Influenza Hospitalization Surveillance Network (FluSurv-NET) for the 2017-2018 influenza season will begin later this season.
- Additional data, including hospitalization rates during other influenza seasons, can be found at http://gis.cdc.gov/GRASP/Fluview/FluHospRates.html and http://gis.cdc.gov/grasp/fluview/FluHospChars.html.
-
Mortality Surveillance:
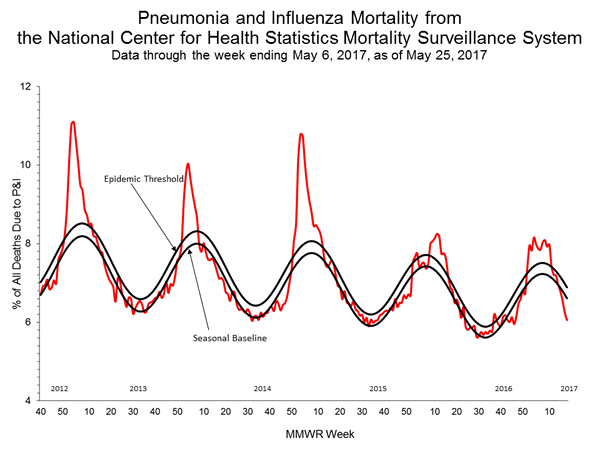
- The proportion of deaths attributed to pneumonia and influenza (P&I) was 5.4% for the week ending September 23, 2017 (week 38). This percentage is below the epidemic threshold of 6.0% for week 38 in the National Center for Health Statistics (NCHS) Mortality Surveillance System.
- Region and state-specific data are available at http//gis.cdc.gov/grasp/fluview/mortality.html.
-
Pediatric Deaths:
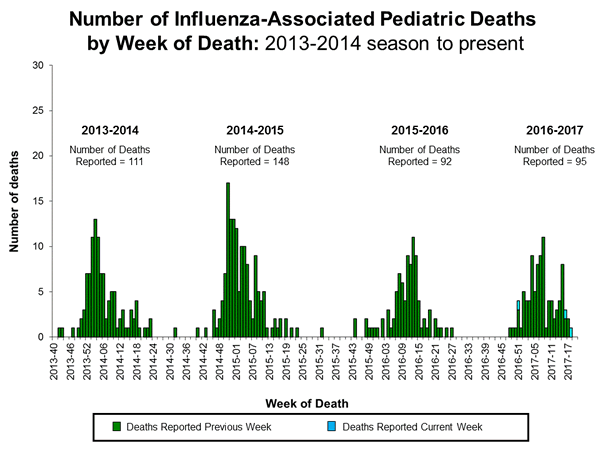
- No influenza-associated pediatric deaths have been reported to CDC for the 2017-2018 season.
- Additional information on pediatric deaths is available on FluView Interactive at: https://gis.cdc.gov/GRASP/Fluview/PedFluDeath.html.
-
Laboratory Data:
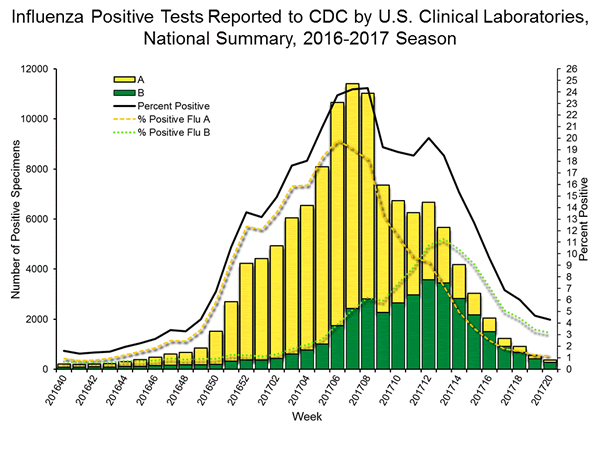
- Nationally, the percentage of respiratory specimens testing positive for influenza viruses in clinical laboratories during the week ending October 7 was 2.7%.
- Regionally, the three week average percent of specimens testing positive for influenza in clinical laboratories ranged from 0.7% to 4.5%.
- During the week ending October 7, of the 270 (2.7%) influenza-positive tests reported to CDC by clinical laboratories, 182 (67.4%) were influenza A viruses and 88 (32.6%) were influenza B viruses.
- The most frequently identified influenza virus type reported by public health laboratories was influenza A virus.
- During the week ending October 7, 62 (86.1%) of the 72 influenza-positive tests reported to CDC by public health laboratories 62 (86.1%) were influenza A viruses and 10 (13.9%) were influenza B viruses. Of the 55 influenza A viruses that were subtyped, 49 (89.1%) were H3N2 viruses and 6 (10.9%) was a (H1N1)pdm09 virus.
- The majority of the influenza viruses collected from the United States during May 21 through October 7, 2017 were characterized antigenically and genetically as being similar to the cell-grown reference viruses representing the 2017–18 Northern Hemisphere influenza vaccine viruses.
- No antiviral resistance data is available for specimens collected after October 1, 2017. None of the viruses tested from May 21-September 30, 2017 were found to be resistant to oseltamivir, zanamivir, or peramivir. Antiviral resistance data will be updated weekly starting later in the season.
FluView is available – and past issues are archived – on the CDC website.
Note: Delays in reporting may mean that data changes over time. The most up to date data for all weeks during the 2017-2018 season can be found on the current FluView and FluView Interactive.
- Page last reviewed: October 13, 2017
- Page last updated: October 13, 2017
- Content source:
- Centers for Disease Control and Prevention, National Center for Immunization and Respiratory Diseases (NCIRD)
- Page maintained by: Office of the Associate Director for Communication, Digital Media Branch, Division of Public Affairs