

Zika Cases in the United States
 ShareCompartir
Cumulative Zika Virus Disease Case Counts in the United States, 2015-2017
Provisional Data* as of October 11, 2017
Zika virus disease became a nationally notifiable condition in 2016. Cases are reported to CDC by state, territorial, and local health departments using standard case definitions. This web page contains cumulative provisional data reported to ArboNET for January 1, 2015 – October 11, 2017.
US States
- 5,534 symptomatic Zika virus disease cases reported†
- 5,259 cases in travelers returning from affected areas
- 225 cases acquired through presumed local mosquito-borne transmission
- 50 cases acquired through other routes, including sexual transmission (N=48), laboratory transmission (N=1), and person-to-person through an unknown route (N=1)
US Territories
- 37,088 symptomatic Zika virus disease cases reported†
- 147 cases in travelers returning from affected areas
- 36,941 cases acquired through presumed local mosquito-borne transmission
- 0 cases acquired through other routes‡
Footnotes
*Data are provisional and might not reflect the actual number of Zika virus disease cases due to delays in reporting.
†Excludes congenital disease cases. Data reported to the US Zika Pregnancy Registry for outcomes of pregnancies with laboratory evidence of possible Zika virus infection in the United States is available on Outcomes of Pregnancies with Laboratory Evidence of Possible Zika Virus Infection in the United States.
‡Sexually transmitted cases are not reported for US territories because with local transmission of Zika virus it is not possible to determine whether infection occurred due to mosquito-borne or sexual transmission.
Monthly Zika Virus Disease Cases
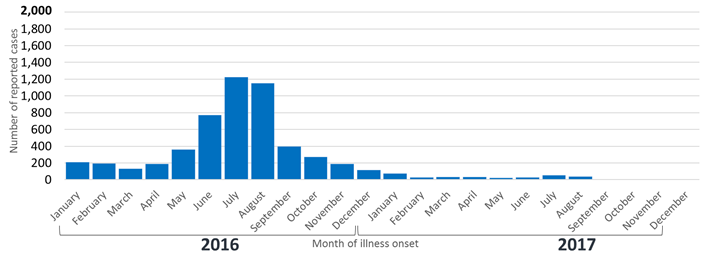
Figure 1 shows provisional data for laboratory-confirmed symptomatic Zika virus disease cases reported to ArboNET by US states (excluding territories) from January 1, 2016 – October 11, 2017.
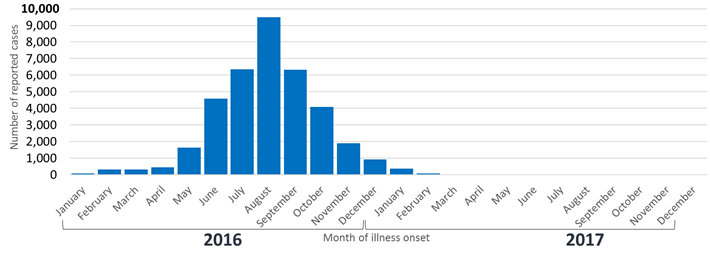
Figure 2 shows provisional data for laboratory-confirmed symptomatic Zika virus disease cases reported to ArboNET by territories (excluding US states) from January 1, 2016 – October 11, 2017.
*Includes reported confirmed and probable Zika virus disease cases per the CSTE case definitions
- Page last reviewed: October 12, 2017
- Page last updated: October 12, 2017
- Content source: