

Invasive Candidiasis Statistics
 ShareCompartir
How common is invasive candidiasis?
Invasive candidiasis is a common healthcare-associated infection: it’s estimated that approximately 46,000 cases of healthcare-associated invasive candidiasis occur each year in the US.1 Candidemia, the most common form of invasive candidiasis, is one of the most common bloodstream infections in the United States.2,3 The incidence of candidemia is approximately 14 per 100,000 people in the Baltimore area and 10 per 100,000 people in the Atlanta area,4 but the incidence and the distribution of Candida species causing infection vary substantially by geographic location and patient population.5
Public health surveillance for candidemia in the United States
CDC performs surveillance for candidemia through the Emerging Infections Program (EIP), a network of ten state health departments and their collaborators in local health departments, academic institutions, other federal agencies, public health and clinical laboratories, and healthcare facilities.
Active, population-based surveillance for candidemia is being conducted in seven EIP sites: Georgia, Maryland, Minnesota, New Mexico, New York, Oregon, and Tennessee (Table 1).
| Emerging Infections Program site | Current candidemia surveillance ongoing since (year) | Area under surveillance | Size of Population under surveillance |
|---|---|---|---|
|
Georgia |
2008 |
8 counties in Metropolitan Atlanta |
3.9 million persons |
|
Maryland |
2008 |
Baltimore City and County |
1.4 million persons |
|
Minnesota |
2017 |
7 counties |
2.9 million persons |
|
New Mexico |
2017 |
Bernalillo County |
677,000 persons |
|
New York |
2016 |
Monroe County |
750,000 persons |
|
Oregon |
2011 |
3 counties in Metropolitan Portland |
1.6 million persons |
|
Tennessee |
2011 |
17 counties that incorporate Knoxville and surrounding areas |
1.4 million persons |
Through this program, CDC monitors epidemiologic trends in candidemia and performs species confirmation and antifungal susceptibility testing on all available Candida bloodstream isolates to:
- Track incidence of candidemia and monitor trends,
- Detect emergence and spread of resistance to antifungal agents and communicate these results back to submitting laboratories,
- Determine the burden of infections due to antifungal-resistant Candida species,
- Understand and describe specific genetic mutations associated with resistance, and
- Identify areas where candidemia prevention and intervention strategies can be focused.
CDC also collects data on healthcare-associated infections, including central line-associated Candida infections through the National Healthcare Safety Network (NHSN), the largest healthcare-associated infection reporting system in the US.
Candidemia trends in the United States
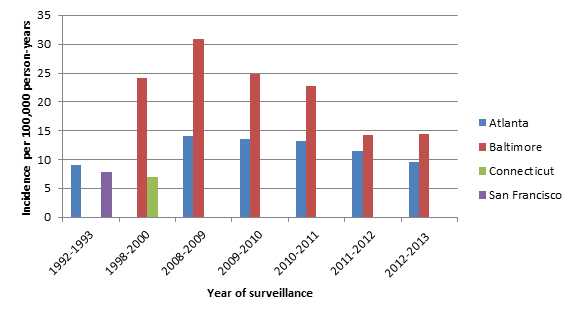
Overall, candidemia rates have increased over the past 20 years in the United States, though recent rates have decreased in the past few years (Figure 1).4–8 The two places with surveillance data from the 1990s and today are Atlanta and Baltimore. CDC has conducted surveillance in other sites (Connecticut and San Francisco), but only during one time period (Figure 1). CDC’s active, population-based surveillance showed that the crude incidence rate per 100,000 person-years increased from 9.1 during 1992–1993 to 14.1 in 2008 in Atlanta and increased from 24.2 during 1998–2000 to 30.9 in 2008 in Baltimore.6–8 Rates have decreased since 2008. In 2013, the crude incidence rate was 9.5 in Atlanta and 14.4 in Baltimore.4 It is possible that the observed declines in candidemia during 2008–2013 are related to healthcare delivery improvements such as those involving catheter care and maintenance.4
Figure 1: Candidemia incidence rates per 100,000 person-years by area and surveillance period6–8
Demographic trends
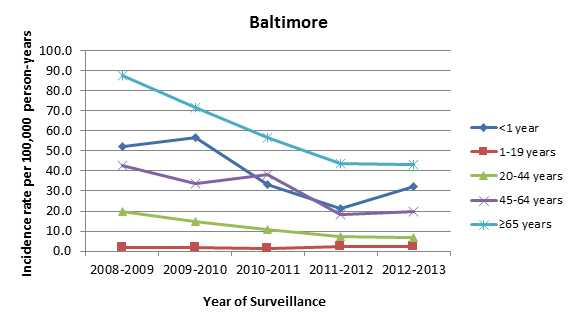
There have been important changes in the rates of candidemia by age group: rates have decreased significantly in infants, but remain high compared with other groups.6,9,10 The reasons for the decline in the rates of candidemia in infants are not fully understood but may be related to factors such as fluconazole prophylaxis in high-risk infants or improved infection control practices such as hand hygiene and catheter care.6 Adults aged 65 and older comprise the age group with the highest incidence rates of candidemia (Figures 2 and 3).4,6 The high rates of candidemia among older adults could be due to the high prevalence of risk factors in this population such as diabetes, ICU admissions, or use of immunosuppressive therapies.4
Figure 2: Candidemia incidence rates per 100,000 person-years, by age group, 2008–2013, Atlanta4
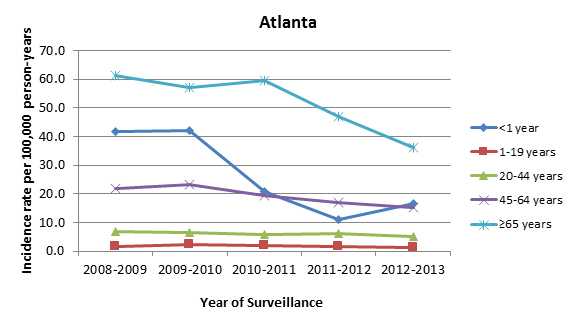
Figure 3: Candidemia incidence rates per 100,000 person-years, by age group, 2008–2013, Baltimore4
Trends in species distribution
Up to 95% of all invasive Candida infection in the US are caused by five species of Candida: C.albicans, C. glabrata, C. parapsilosis, C. tropicalis, and C. krusei, although the proportion of infections caused by each species varies by geographic region and by patient population.9 C. albicans is the most common species causing invasive Candida infection, although the proportion of Candida infections caused by C. albicans has decreased during the last 20 years.5,11,12 Altogether, non-C. albicans species now cause approximately two-thirds of candidemia cases in the US.4,11 In some locations under surveillance, C. glabrata is the most common species recovered.4
Trends in antifungal resistance
The changes in the distribution of Candida species causing invasive infections are concerning because some species of Candida are either naturally resistant or are becoming increasingly resistant to the first-line and second-line antifungal medications, namely, fluconazole and echinocandins. Approximately 7% of all Candida bloodstream isolates tested at CDC are resistant to fluconazole, most of which are Candida glabrata.4,11 CDC’s surveillance data indicate that the proportion of Candida isolates that are resistant to fluconazole has remained fairly constant over the past twenty years, but the increasing proportion of certain species causing infection, especially Candida glabrata, could lead to an increase in resistance.7,8,11 In contrast, echinocandin resistance appears to be on the rise; approximately 1% of all Candida isolates tested at CDC show echinocandin resistance, but up to 5% of some species, most notably C. glabrata, show resistance (Figure 4).4,11 The problem will likely continue to evolve unless more is done to prevent further development of resistance and further spread of these infections. Microbiology laboratories should consider antifungal susceptibility testing for C. glabrata causing sterile-site infections, as detection of echinocandin-resistant or multi-drug-resistant Candida can influence therapy. The Clinical and Laboratory Standards Institute (CLSI) has recently adopted species-specific minimum inhibitory concentration (MIC) breakpoints for Candida species.13 Click here for more information about antifungal resistance.
Figure 4: Percent of Candida bloodstream isolates* tested at CDC showing fluconazole, echinocandin, or multi-drug resistance by surveillance year4
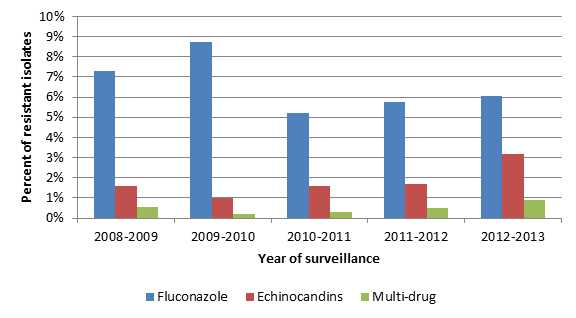
*74% of all echinocandin-resistant isolates and 94% of all multi-drug-resistant isolates were C. glabrata
Deaths due to invasive candidiasis
Invasive Candida infections are often associated with high rates of morbidity and mortality as well as increases in cost and length of hospital stay. CDC’s surveillance data indicate that the 30-day all-cause (crude) mortality among people with candidemia is approximately 30%.6 However, because people who develop invasive candidiasis are typically already sick with other medical conditions, it can be difficult to determine the proportion of deaths directly attributable to the infection. One study estimated the mortality attributable to candidemia to be 19-24%.14
Invasive candidiasis outbreaks
Most cases of invasive candidiasis are not associated with outbreaks; however, a few hospital-associated clusters linked to common sources have been documented. For example, several clusters of invasive candidiasis in neonatal intensive care units were due to C. parapsilosis likely transmitted via healthcare workers’ hands.15–17
References
- CDC – Antibiotic Resistance Threats in the United States, 2013: Fluconazole-Resistant Candida [PDF – 114 pages]
- Wisplinghoff H, Bischoff T, Tallent SM, Seifert H, Wenzel RP, Edmond MB. Nosocomial bloodstream infections in US hospitals: analysis of 24,179 cases from a prospective nationwide surveillance study. Clin Infect Dis. 2004 Aug 1;39(3):309-17.
- Magill SS, Edwards JR, Bamberg W, Beldavs ZG, Dumyati G, Kainer MA, et al. Multistate point-prevalence survey of health care-associated infections. N Engl J Med. 2014 Mar 27;370(13):1198-208.
- Cleveland AA, Harrison LH, Farley MM, Hollick R, Stein B, Chiller TM, et al. Declining Incidence of Candidemia and the Shifting Epidemiology of Candida Resistance in Two US Metropolitan Areas, 2008-2013: Results from Population-Based Surveillance. PLOS ONE. 2015.
- Pfaller MA, Diekema DJ. Epidemiology of invasive candidiasis: a persistent public health problem. Clin Microbiol Rev. 2007 Jan;20(1):133-63.
- Cleveland AA, Farley MM, Harrison LH, Stein B, Hollick R, Lockhart SR, et al. Changes in incidence and antifungal drug resistance in candidemia: results from population-based laboratory surveillance in Atlanta and Baltimore, 2008-2011. Clin Infect Dis. 2012 Nov 15;55(10):1352-61.
- Kao AS, Brandt ME, Pruitt WR, Conn LA, Perkins BA, Stephens DS, et al. The epidemiology of candidemia in two United States cities: results of a population-based active surveillance. Clin Infect Dis. 1999 Nov;29(5):1164-70.
- Hajjeh RA, Sofair AN, Harrison LH, Lyon GM, Arthington-Skaggs BA, Mirza SA, et al. Incidence of bloodstream infections due to Candida species and in vitro susceptibilities of isolates collected from 1998 to 2000 in a population-based active surveillance program. J Clin Microbiol. 2004 Apr;42(4):1519-27.
- Lockhart S. Current Epidemiology of Candida Infection. Clinical Microbiology Newsletter. 2014;36(17):131-6.
- Fisher BT, Ross RK, Localio AR, Prasad PA, Zaoutis TE. Decreasing rates of invasive candidiasis in pediatric hospitals across the United States. Clin infect dis. 2014 Jan;58(1):74-7.
- Lockhart SR, Iqbal N, Cleveland AA, Farley MM, Harrison LH, Bolden CB, et al. Species identification and antifungal susceptibility testing of Candida bloodstream isolates from population-based surveillance studies in two U.S. cities from 2008 to 2011. J Clin Microbiol. 2012 Nov;50(11):3435-42.
- Pfaller M, Neofytos D, Diekema D, Azie N, Meier-Kriesche HU, Quan SP, et al. Epidemiology and outcomes of candidemia in 3648 patients: data from the Prospective Antifungal Therapy (PATH Alliance(R)) registry, 2004-2008. Diagn Microbiol Infect Dis. 2012 Dec;74(4):323-31.
- Clinical and Laboratory Standards Institute. Reference Method for Broth Dilution Antifungal Susceptibility Testing of Yeasts; Fourth Informational Supplement, M27-S4. 2012.
- Morgan J, Meltzer MI, Plikaytis BD, Sofair AN, Huie-White S, Wilcox S, et al. Excess mortality, hospital stay, and cost due to candidemia: a case-control study using data from population-based candidemia surveillance. Infect Control Hosp Epidemiol. 2005 Jun;26(6):540-7.
- Clark TA, Slavinski SA, Morgan J, Lott T, Arthington-Skaggs BA, Brandt ME, et al. Epidemiologic and molecular characterization of an outbreak of Candida parapsilosis bloodstream infections in a community hospital. J Clin Microbiol. 2004 Oct;42(10):4468-72.
- Lupetti A, Tavanti A, Davini P, Ghelardi E, Corsini V, Merusi I, et al. Horizontal transmission of Candida parapsilosis candidemia in a neonatal intensive care unit. J Clin Microbiol. 2002 Jul;40(7):2363-9.
- Huang YC, Lin TY, Leu HS, Peng HL, Wu JH, Chang HY. Outbreak of Candida parapsilosis fungemia in neonatal intensive care units: clinical implications and genotyping analysis. Infection. 1999 Mar-Apr;27(2):97-102.
- Page last reviewed: January 25, 2017
- Page last updated: January 25, 2017
- Content source: