Skip directly to search Skip directly to A to Z list Skip directly to navigation Skip directly to page options Skip directly to site content

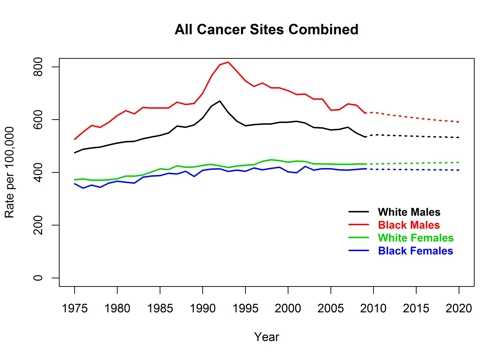
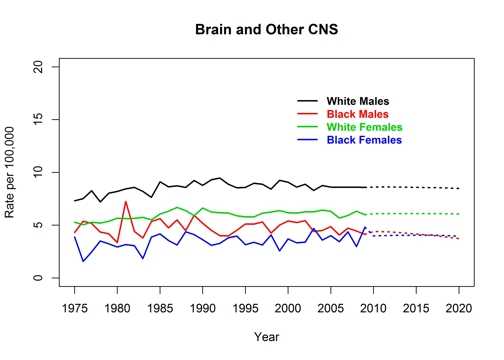
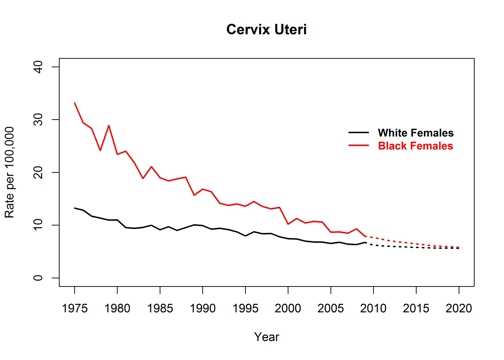
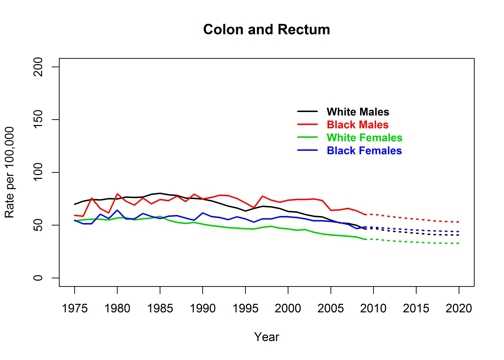
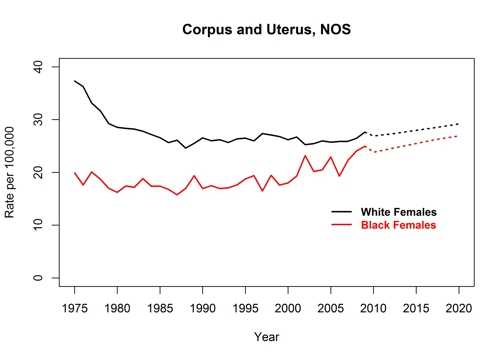
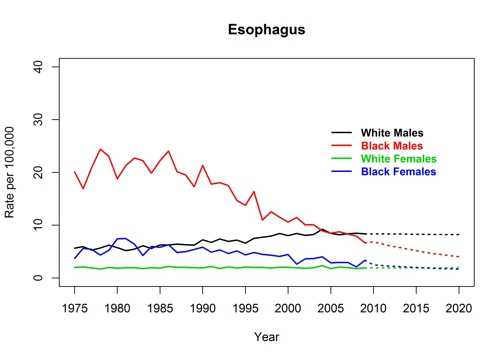
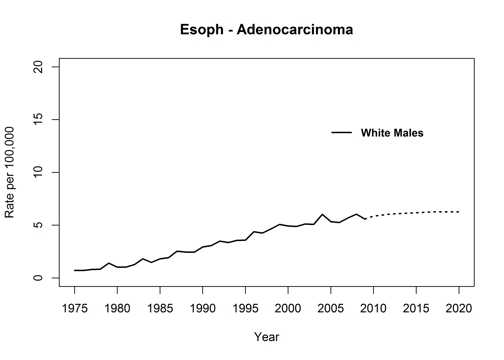
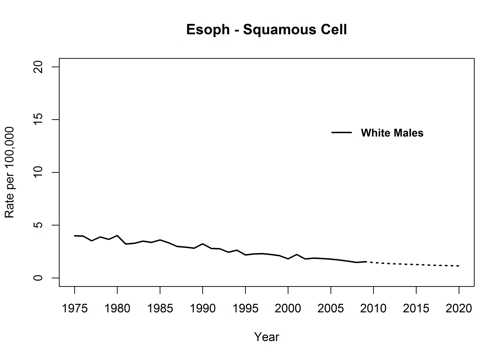
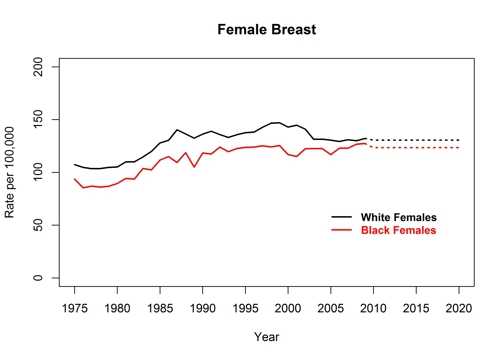
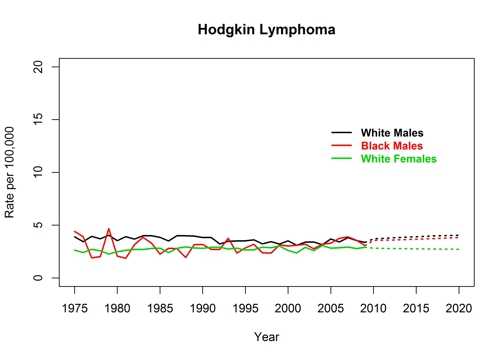
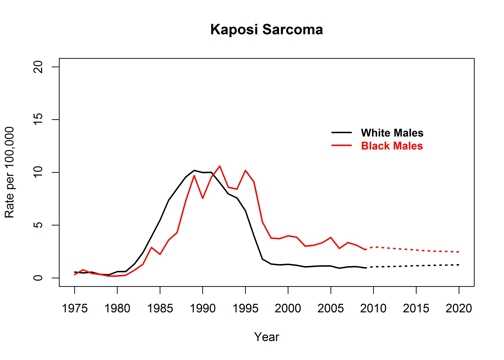
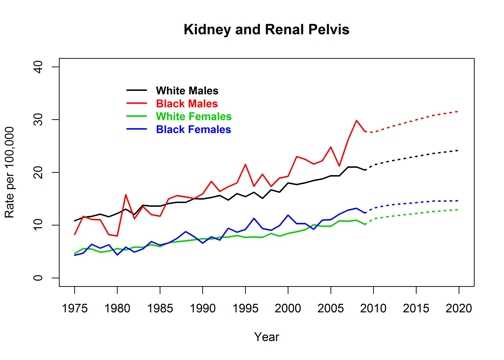
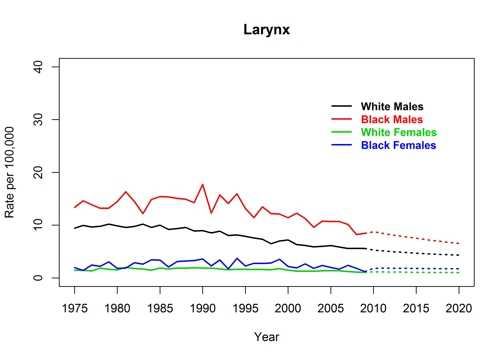
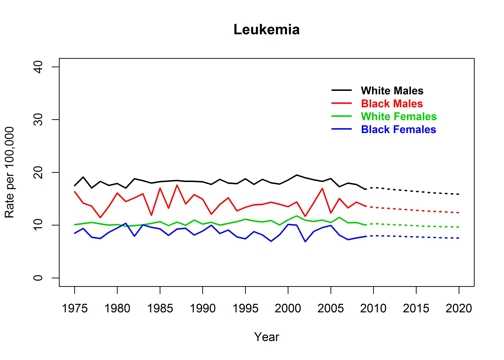
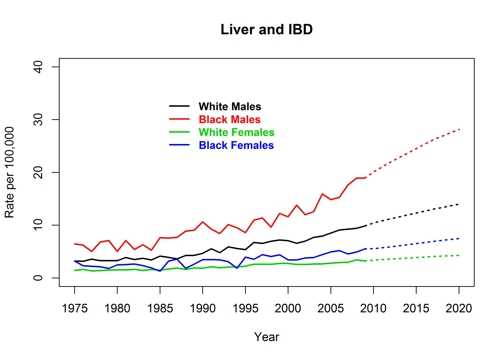
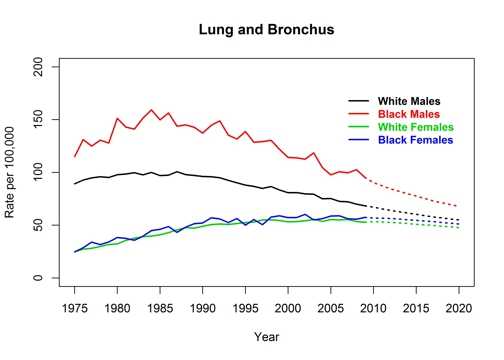
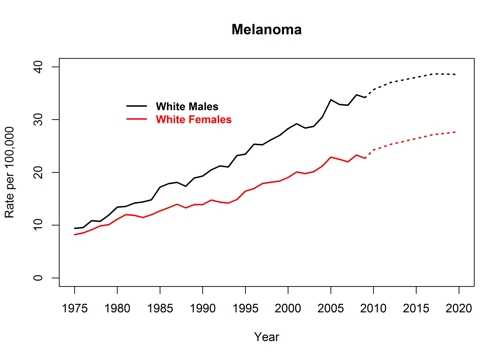
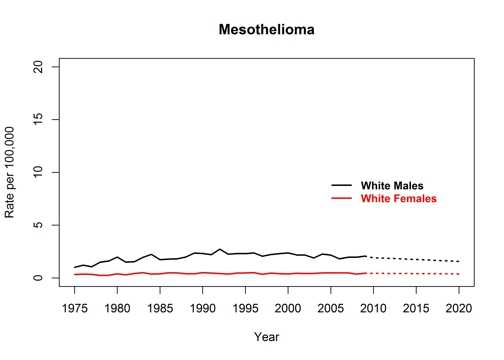
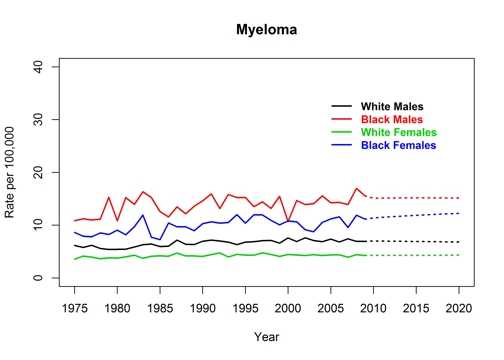
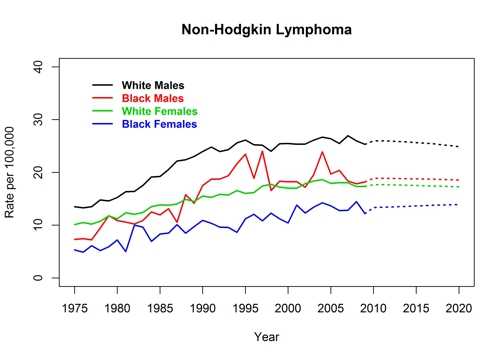
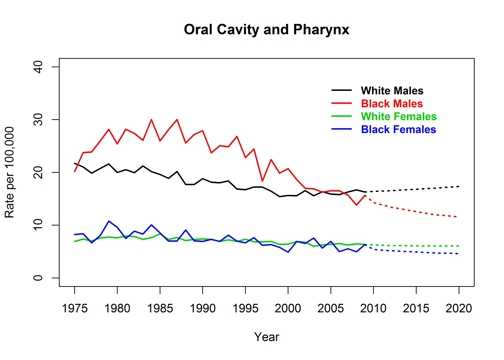
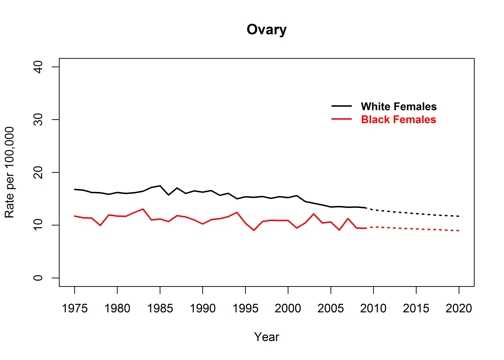
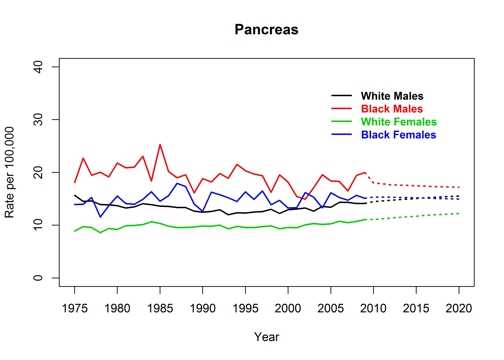
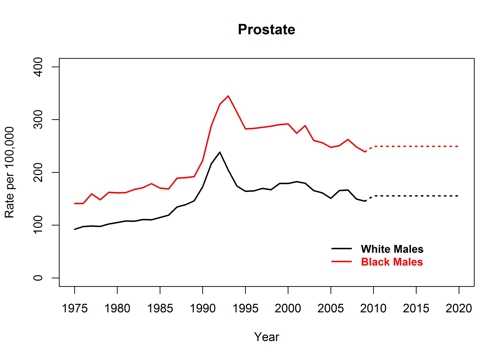
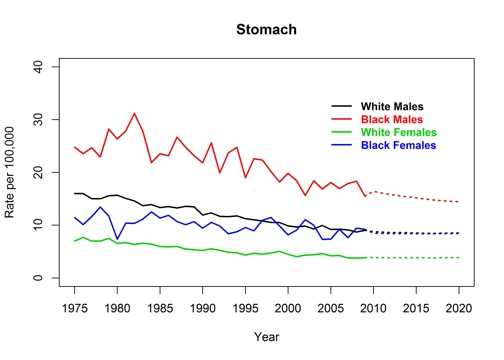
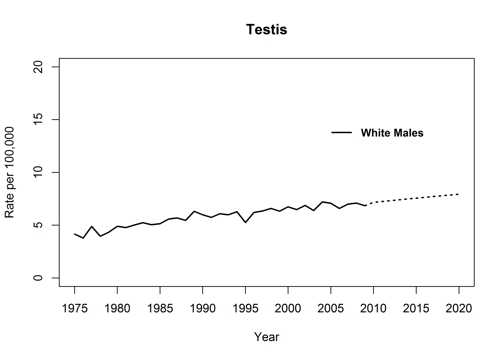
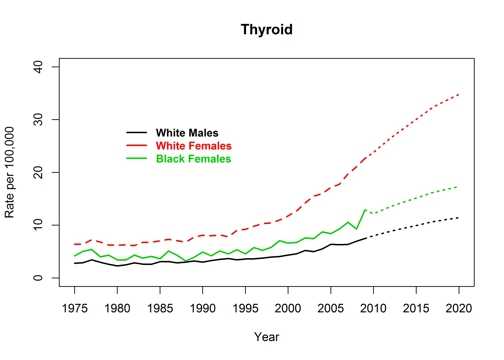
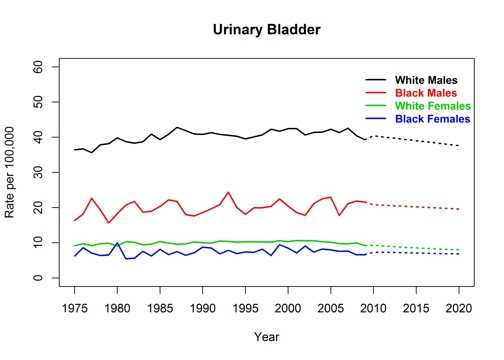
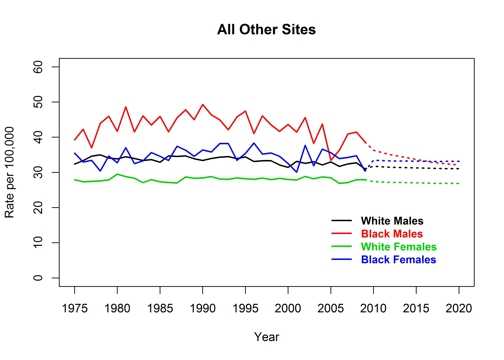
Actual and Projected Cancer Incidence Rates, United States, 1975 to 2020

These graphs accompany the article Expected New Cancer Cases and Deaths in 2020.

Graph showing actual and projected incidence rates for all cancer sites combined by race and sex, United States, 1975 to 2020 Graph showing actual and projected incidence rates for brain and other central nervous system cancers by race and sex, United States, 1975 to 2020 Graph showing actual and projected incidence rates for cervical cancer by race, United States, 1975 to 2020 Graph showing actual and projected incidence rates for colorectal cancer by race and sex, United States, 1975 to 2020 Graph showing actual and projected incidence rates for uterine cancer by race, United States, 1975 to 2020 Graph showing actual and projected incidence rates for esophogeal cancer by race and sex, United States, 1975 to 2020 Graph showing actual and projected incidence rates for adenocarcinoma of the esophagus for white males, United States, 1975 to 2020 Graph showing actual and projected incidence rates for squamous cell cancer of the esophagus for white males, United States, 1975 to 2020 Graph showing actual and projected incidence rates for female breast cancer by race, United States, 1975 to 2020 Graph showing actual and projected incidence rates for Hodgkin lymphoma by race and sex, United States, 1975 to 2020 Graph showing actual and projected incidence rates for Kaposi sarcoma for males by race, United States, 1975 to 2020 Graph showing actual and projected incidence rates for cancer of the kidney and renal pelvis by race and sex, United States, 1975 to 2020 Graph showing actual and projected incidence rates for cancer of the larynx by race and sex, United States, 1975 to 2020 Graph showing actual and projected incidence rates for leukemia by race and sex, United States, 1975 to 2020 Graph showing actual and projected incidence rates for cancer of the liver and intrahepatic bile duct by race and sex, United States, 1975 to 2020 Graph showing actual and projected incidence rates for lung and bronchus cancer by race and sex, United States, 1975 to 2020 Graph showing actual and projected incidence rates for melanoma of the skin for white males and females, United States, 1975 to 2020 Graph showing actual and projected incidence rates for mesothelioma for white males and females, United States, 1975 to 2020 Graph showing actual and projected incidence rates for myeloma by race and sex, United States, 1975 to 2020 Graph showing actual and projected incidence rates for non-Hodgkin lymphoma by race and sex, United States, 1975 to 2020 Graph showing actual and projected incidence rates for oropharyngeal cancer by race and sex, United States, 1975 to 2020 Graph showing actual and projected incidence rates for ovarian by race, United States, 1975 to 2020 Graph showing actual and projected incidence rates for pancreatic cancer by race and sex, United States, 1975 to 2020 Graph showing actual and projected incidence rates for prostate cancer by race, United States, 1975 to 2020 Graph showing actual and projected incidence rates for stomach cancer by race and sex, United States, 1975 to 2020 Graph showing actual and projected incidence rates for testicular cancer for white men, United States, 1975 to 2020 Graph showing actual and projected incidence rates for thyroid cancer by race and sex, United States, 1975 to 2020 Graph showing actual and projected incidence rates for urinary bladder cancer by race and sex, United States, 1975 to 2020 Graph showing actual and projected incidence rates for all other cancer sites by race and sex, United States, 1975 to 2020

Top