

Cost Statistics
 ShareCompartir
National and State Cost Estimates
- The total costs attributable to arthritis and other rheumatic conditions (AORC) in the United States in 2003 was approximately $128 billion. This equaled 1.2% of the 2003 U.S. gross domestic product.
- $80.8 billion were direct costs (i.e., medical expenditures).
- $47.0 billion were indirect costs (i.e., lost earnings).
- Total costs attributable to AORC, by state, ranged from $226 million in the District of Columbia to $12.1 billion in California.
- National medical costs attributable to AORC grew by 24% between 1997 and 2003. This rise in medical costs resulted from an increase in the number of people with AORC.
- In 2003, costs attributable to AORC represented between 0.3 to 2.6% of each state’s GDP. For example: in 2003, the costs attributable to AORC in West Virginia were $1.2 billion and this represented 2.6% of West Virginia’s GDP.
Study reports on arthritis costs:
National and state direct and indirect costs are presented in the January 12, 2007 MMWR entitled: National and State Medical Expenditures and Lost Earnings Attributable to Arthritis and Other Rheumatic Conditions — United States, 2003.
A detailed report on the national cost study, including the study methods and comparisons of 1997 and 2003 costs, was published in:
Yelin E, Murphy L, Cisternas M, Foreman A, Pasta D, Helmick C. Medical Care Expenditures and Earnings Losses Among Persons with Arthritis and Other Rheumatic Conditions in 2003, and Comparisons to 1997. Arthritis and Rheumatism 2007;56(5):1397-1407.
State-Specific Gross Domestic Product (GDP)
Yelin E, Cisternas M, Foreman A, Pasta D, Murphy L, Helmick C. National and state medical expenditures and lost earnings attributable to arthritis and other rheumatic conditions — United States, 2003. MMWR 2007;56(1):4–7. html [PDF-306K]
The table below shows the total costs* (in millions of dollars) attributable to arthritis and other rheumatic conditions for each state in 2003.
Total Costs* (in millions) attributable to Arthritis and Other Rheumatic Conditions, By State, United States, 2003
* Total costs = medical expenditures + lost earnings
Yelin E, Cisternas M, Foreman A, Pasta D, Murphy L, Helmick C. National and state medical expenditures and lost earnings attributable to arthritis and other rheumatic conditions — United States, 2003. MMWR 2007;56(1):4–7. html [PDF-65K]
National Medical Expenditures Among People with Arthritis, 1997 to 2005
From 1997 to 2005, total national expenditures among all US adults with arthritis increased by $100 billion. Medical expenditures were $252.0 billion in 1997 and $353.0 billion in 2005. (Cisternas et al 2009)
Why did total national medical expenditures among all adults with arthritis increase from 1997 to 2005?
- The rise in medical expenditures in this time period is attributable to two distinct factors:
- The number of people with arthritis and other rheumatic conditions increased by 22%
- Medical expenditures for each person with arthritis increased by 15%
Total national medical expenditures among US adults with arthritis, 1997 to 2005
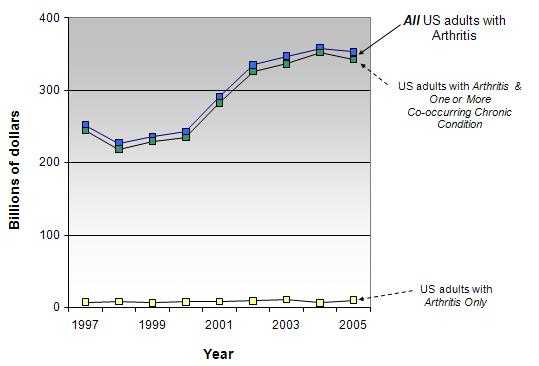
Data source: Medical Expenditure Panel Survey, 1997-2005
Expenditures for each individual are the sum of the following: inpatient, outpatient, office visit, home health, emergency, prescription medications, and other.
The graph above shows that ––
- From 1995 to 2005, the total national medical expenditures among adults with arthritis only remained stable.
- However, total medical expenditures rose by 27% among people who had arthritis and one or more co-occurring chronic conditions.
- This increase in expenditures resulted from a rise in number of people with arthritis who also have co-occurring chronic conditions such as diabetes and heart disease.
- In 1997, 36.8 million people with arthritis had co-occurring chronic conditions and by 2005, this had risen to 44.9 million people.
Cisternas MG, Murphy LB, Yelin EH, Foreman AJ, Pasta DJ, Helmick CG. Trends in Medical Care Expenditures of US Adults with Arthritis and Other Rheumatic Conditions 1997 to 2005 J Rheumatol 2009;36(11):2531-2538. abstract
- Page last reviewed: April 28, 2015
- Page last updated: October 28, 2015
- Content source:
- Maintained By: