

2014 Ebola Outbreak in West Africa - Reported Cases Graphs
Updated February 17, 2016
 ShareCompartir
Graph 1: Total suspected, probable, and confirmed cases of Ebola virus disease in Guinea, Liberia, and Sierra Leone, March 25, 2014 – February 14, 2016, by date of WHO Situation Report, n=28603
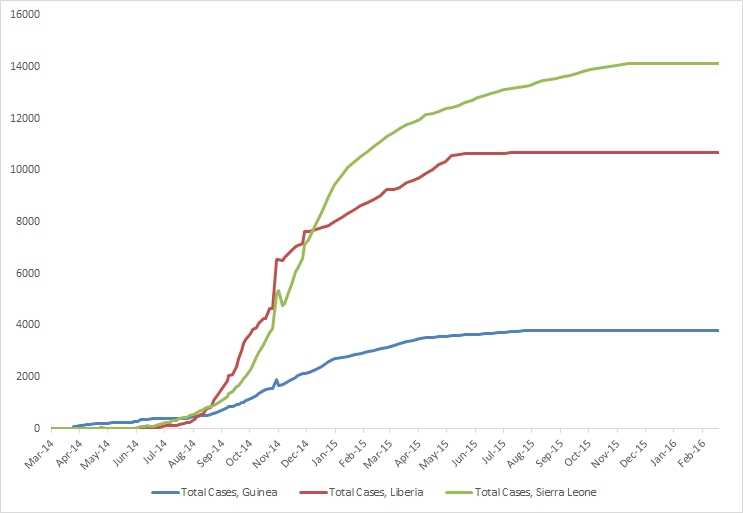
Graph 1 shows the total reported suspected, probable, and confirmed cases in Guinea, Liberia, and Sierra Leone provided in WHO situation reports beginning on March 25, 2014 through the most recent situation report on February 17, 2016.
Graph 2: Total suspected, probable, and confirmed cases and deaths of Ebola virus disease in Guinea, March 25, 2014 – February 14, 2016 by date of WHO Situation Report, n=3804
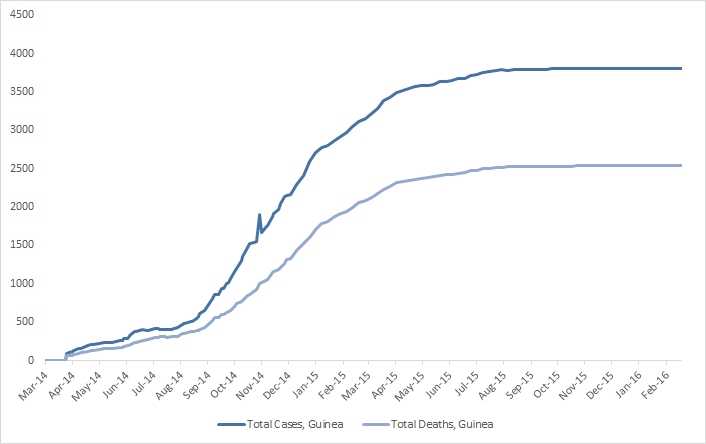
Graph 2 shows the total reported suspected, probable, and confirmed cases and deaths in Guinea provided in WHO situation reports beginning on March 25, 2014 through the most recent situation report on February 17, 2016.
Reported suspected, probable, and confirmed cases and deaths in Guinea [CSV – 1 page]
Graph 3: Total suspected, probable, and confirmed cases and deaths of Ebola virus disease in Liberia, March 25, 2014 – February 14, 2016, by date of WHO Situation Report, n=10675
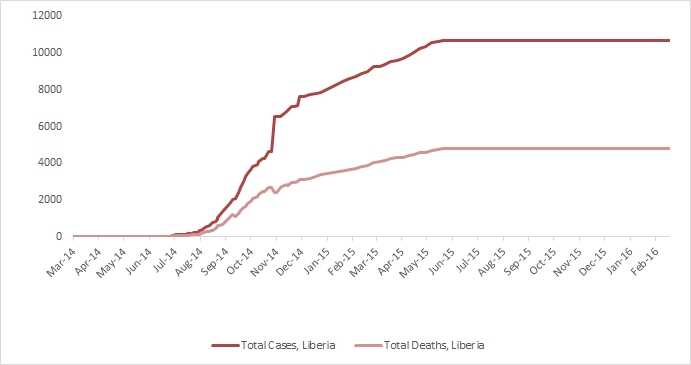
Graph 3 shows the total reported suspected, probable, and confirmed cases and deaths in Liberia provided in WHO situation reports beginning on March 25, 2014 through the most recent situation report on February 17, 2016.
Reported suspected, probable, and confirmed cases and deaths in Liberia [CSV – 1 page]
Graph 4: Total suspected, probable, and confirmed cases and deaths of Ebola virus disease in Sierra Leone, March 25, 2014 – February 14, 2016, by date of WHO Situation Report, n=14124
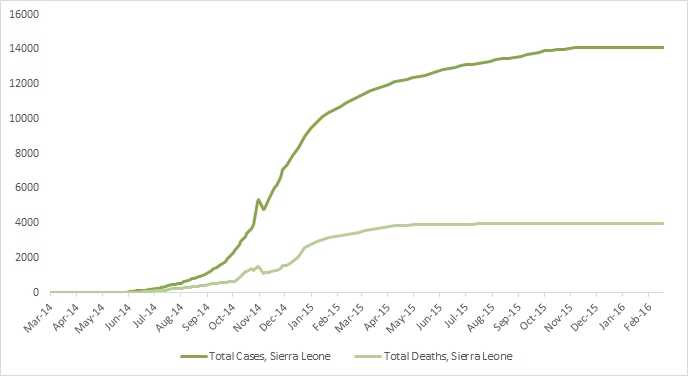
Graph 4 shows the total reported suspected, probable, and confirmed cases and deaths in Sierra Leone provided in WHO situation reports beginning on March 25, 2014 through the most recent situation report on February 17, 2016.
Reported suspected, probable, and confirmed cases and deaths in Sierra Leone [CSV – 1 page]
- Page last reviewed: February 17, 2016
- Page last updated: February 17, 2016
- Content source: