


Opioid Prescribing is Still High and Varies from County to County
Where you live makes a difference
 ShareCompartir
This Vital Signs examined opioid prescribing data from 2006-2015, including rates, amounts, dosages, and durations they were prescribed, and the report looks at the amounts prescribed by county from 2010-2015. The amount of opioids prescribed is measured by morphine milligram equivalents (MME) or the amount of opioids measured in milligrams, which accounts for the differences in opioid drug type and strength.
The counties that had the highest prescribing rates had some similar qualities, such as: greater percentage of non-Hispanic white residents, greater prevalence of diabetes and arthritis, micropolitan status (small cities and big towns, but non-metro), and higher unemployment.
Healthcare providers can follow the CDC Guideline for Prescribing Opioids for Chronic Pain, which includes recommendations such as:
- Use opioids only when benefits outweigh risks.
- Start with the lowest effective dose of immediate-release opioids. For acute pain, prescribe only the number of days that the pain is expected to be severe enough to require opioids.
- Reassess benefits and risks when considering dose increases. Healthcare providers can also use state-based prescription drug monitoring programs (PDMPs) to help identify patients at risk of addiction or overdose.
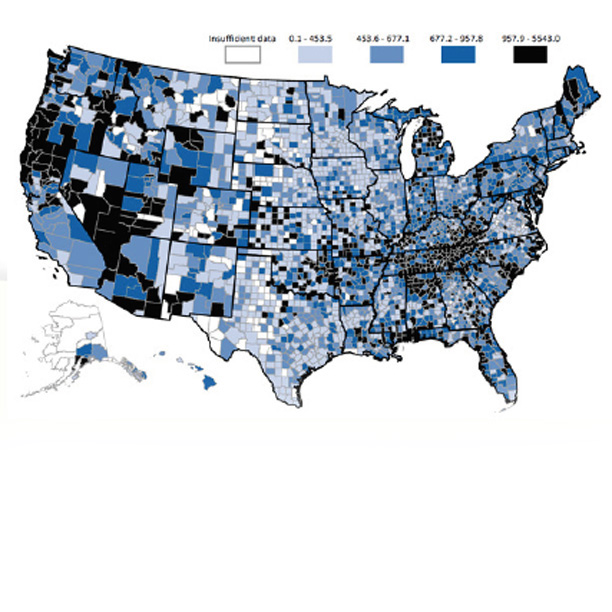
The amount of opioids prescribed per person varied widely among counties in 2015.

Too many people are getting opioid prescriptions for too many days at too high a dose.

Healthcare providers should prescribe the lowest effective dose of immediate-release opioids, and for only enough days where the pain is severe enough to require opioids.

Healthcare providers should work with their patients to see if the benefits of prescribing opioids outweigh the risks.

Opioid prescribing is still high and inconsistent across counties in the United States.

Health care providers can use CDC’s opioid prescribing guideline and their state’s prescription drug monitoring programs (PDMP) to help keep patients safe from opioid misuse and overdose.
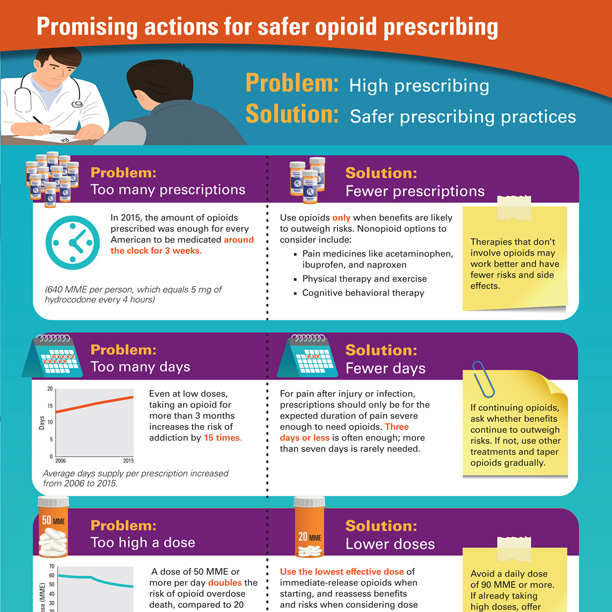
Promising actions for safer opioid prescribing.
Opioid Prescribing
Opioid Prescribing

Opioid Prescribing
Providers in the highest prescribing counties prescribed 6 times more opioids per person than the lowest prescribing counties in 2015
Opioid Prescribing
Amount of opioids prescribed per person in 2015 was about 3 times as high as in 1999
Half of US counties had a decrease in the amount of opioids prescribed per person from 2010 to 2015
Contact Information
(404) 639-3286
media@cdc.gov
Factsheet:
English [PDF 4.68 MB](https://www.cdc.gov/vitalsigns/pdf/2017-07-vitalsigns.pdf)
Spanish [PDF 4.68 MB](https://www.cdc.gov/spanish/signosvitales/pdf/2017-07-vitalsigns.pdf)
Anne Schuchat, MD

“The amount of opioids prescribed in the U.S. is still too high, with too many opioid prescriptions for too many days at too high a dosage. Healthcare providers have an important role in offering safer and more effective pain management while reducing risks of opioid addiction and overdose.”
Anne Schuchat, MD – Principal Deputy Director, Centers for Disease Control and Prevention
Debbie Dowell, MD, MPH

“While some variation in opioid prescribing is expected and linked to factors such as the prevalence of painful conditions, differences in these characteristics explain only a fraction of the wide variation in opioid prescribing across the United States. This variation highlights the need for health care providers to consider evidence-based guidance when prescribing opioids.”
Debbie Dowell, MD, MPH – Chief Medical Officer, Division of Unintentional Injury Prevention (DUIP), National Center for Injury Prevention and Control (NCIPC)
Related Links
- Press Release: Opioids – English | Spanish
- Morbidity and Mortality Weekly Report (MMWR): Vital Signs: Changes in Opioid Prescribing in the United States, 2006-2015
- Vital Signs: Home | July 2017 Vital Signs | Fact Sheet [PDF 4.68MB] | Topics
- Vital Signs: (Spanish) Home | 2017 Julio – Signos Vitales | Fact Sheet [PDF 4.68MB] | Topics
- CDC Opioid Overdose Website
- CDC Guideline for Prescribing Opioids for Chronic Pain
- Online Training Series for Healthcare Providers
- Prescription Drug Monitoring Program (PDMP)
- U.S. Department of Health & Human Services Strategy for Fighting Opioid Crisis
- PDMP Center of Excellence, Brandeis University
- JAMA Special Communication: CDC Guideline for Prescribing Opioids for Chronic Pain
- New Data on Opioid Use and Prescribing in the United States
- Providers’ Clinical Support System for Medication Assisted Treatment
- Providers’ Clinical Support System for Opioid Therapies
- MedlinePlus – Prescription Drug Abuse
- MedlinePlus – Pain Relievers
- Opioid Abuse and Addiction
- Abuso y adicción de opioids (Español)
- Office of the National Coordinator for Health Information Technology (ONC) – Linking PDMPs to Health IT
- National Alliance for Model State Drug Laws
- Vital Signs – Opioid Prescribing: Where you live matters English [Podcast – 1:15 minutes] | Spanish [Podcast 1:15 minutes]
- Vital Signs – Opioid Prescribing: Where you live matters [PSA – 0:60 seconds]
Guideline Resources
- Page last reviewed: July 6, 2017
- Page last updated: July 6, 2017
- Content source: