

Severe Maternal Morbidity in the United States
 ShareCompartir
Severe maternal morbidity (SMM) includes unexpected outcomes of labor and delivery that result in significant short- or long-term consequences to a woman’s health.1 Using the most recent list of indicators, SMM affected more than 50,000 women in the United States during 2013–2014 and has been steadily increasing in recent years. This web report updates our previous report by adding information about SMM for 2013 and 2014, the 2 most recent years for which data are available on a national level.
It is not entirely clear why SMM is increasing, but changes in the overall health of the population of women giving birth may be contributing to increases in complications. For example, increases in maternal age,2 pre-pregnancy obesity,3,4 preexisting chronic medical conditions,5,6 and cesarean delivery2,7 have been documented. The consequences of the increasing SMM prevalence, in addition to the health effects for the woman, are wide-ranging and include increased medical costs and longer hospitalization stays.8 Tracking and understanding patterns of SMM, along with developing and carrying out interventions to improve the quality of maternal care are essential to reducing SMM.
How Does CDC Identify Severe Maternal Morbidity?
To identify delivery hospitalizations with SMM, CDC uses administrative hospital discharge data and International Classification of Diseases (ICD) diagnosis and procedure codes. The original list of 25 SMM indicators based on the 9th Revision of ICD was published in 2012.8 In October 2015, the United States transitioned to the 10th Revision of ICD to code diagnoses and procedures. CDC, along with our clinical and public health partners, took the opportunity to review this new version of ICD coding to update the indicators, taking into account results from validation studies. The updated list of 21 indicators and corresponding ICD codes used to identify delivery hospitalizations with SMM for both ICD-9 and ICD-10 is displayed in the table below and can be used to track SMM when using administrative hospital discharge data from October 2015 and beyond.
Trends in Severe Maternal Morbidity
The following figures show trends over time in SMM in the United States in 2-year increments from 1993–2014 using data from the National Inpatient Sample.
Severe Maternal Morbidity, 1993–2014
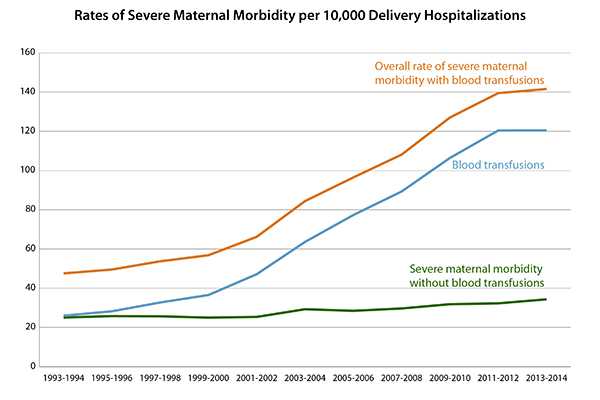
This figure shows the rate of SMM per 10,000 delivery hospitalizations from 1993–2014. Women who received blood transfusions (procedure in which a patient is given donated blood generally in response to excessive bleeding around delivery) account for the greatest fraction of women with SMM. Hence, the SMM rates are shown for women with any indicator of SMM, women who had only transfusion as an indicator, and women who had some indicator other than transfusion.
The overall rate of SMM increased almost 200% over the years, from 47.6 in 1993–1994 to 141.6 in 2013–2014. This increase has been mostly driven by blood transfusions, which increased from 26.0 in 1993–1994 to 120.4 in 2013–2014. After excluding blood transfusions, the rate of SMM increased almost 40% over time, from 25.1 in 1993–1994 to 34.3 in 2013–2014.
Hysterectomy and Ventilation, 1993–2014
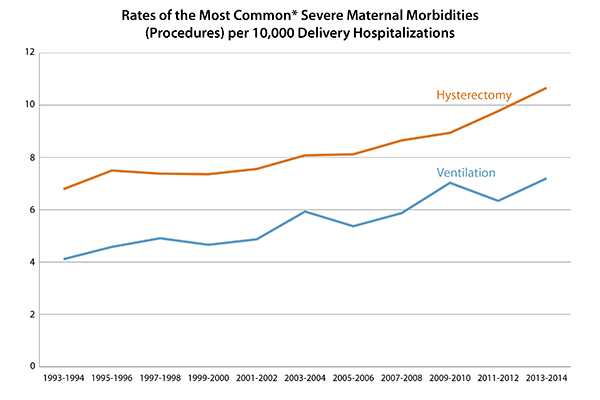
*After excluding blood transfusions
After excluding blood transfusions, the next most common SMM procedures are hysterectomy (surgical removal of the uterus) and mechanical ventilation (using a machine that helps a patient breathe). This figure shows the rate of hysterectomy and ventilation per 10,000 delivery hospitalizations from 1993–2014.
The rate of hysterectomy increased almost 60% over time, from 6.8 in 1993–1994 to 10.7 in 2013–2014. The rate of ventilation increased by 75% over the years, from 4.1 in 1993–1994 to 7.2 in 2013–2014.
Disseminated Intravascular Coagulation, Adult Respiratory Distress Syndrome, and Acute Renal Failure, 1993–2014
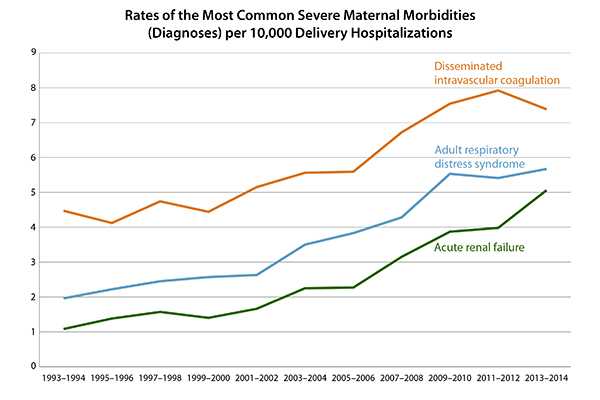
This figure shows the rate of the most common SMM diagnoses (disseminated intravascular coagulation, adult respiratory distress syndrome, and acute renal failure) per 10,000 delivery hospitalizations from 1993–2014. Disseminated intravascular coagulation is a serious condition in which normal clotting is disrupted, resulting in excessive bleeding. Adult respiratory distress syndrome occurs when lung tissues become inflamed and fluid builds up in the lungs, preventing enough oxygen from getting into the blood. Acute renal failure is when the kidneys suddenly stop working.
Disseminated intravascular coagulation fluctuated through the years, but overall, increased by about 65% over time, from 4.5 in 1993–1994 to 7.4 in 2013–2014. Adult respiratory distress syndrome increased almost 2-fold over time, from 2.0 in 1993-1994 to 5.7 in 2013–2014. Acute renal failure increased by almost 4-fold over the years, from 1.1 in 1993–1994 to 5.1 in 2013–2014.
Rates in Severe Morbidity Indicators per 10,000 Delivery Hospitalizations, 1993–2014
| SMM indicator | 1993–1994 | 1997–1998 | 2001–2002 | 2005–2006 | 2009–2010 | 2013–2014 | Percentage changes from 1993 to 2014 |
|---|---|---|---|---|---|---|---|
| Cardiac arrest or ventricular fibrillation | 0.24 | 0.46 | 0.40 | 0.65 | 0.56 | 0.62 | 158 |
| Acute congestive heart failure or pulmonary edema | 2.44 | 2.96 | 2.99 | 3.46 | 2.86 | 2.58 | 6 |
| Adult respiratory distress syndrome | 1.96 | 2.45 | 2.63 | 3.83 | 5.53 | 5.67 | 189 |
| Acute renal failure | 1.08 | 1.57 | 1.66 | 2.27 | 3.87 | 5.06 | 369 |
| Disseminated intravascular coagulation | 4.47 | 4.74 | 5.15 | 5.59 | 7.54 | 7.38 | 65 |
| Shock | 0.83 | 0.89 | 0.99 | 1.49 | 2.35 | 2.77 | 234 |
| Eclampsia | 3.21 | 2.86 | 2.84 | 2.75 | 2.73 | 2.12 | -34 |
| Puerperal cerebrovascular disorders | 1.45 | 1.53 | 1.27 | 1.55 | 1.13 | 1.03 | -29 |
| Heart failure or arrest during surgery or procedure | 0.56 | 0.52 | 0.47 | 0.57 | 0.53 | 0.31 | -45 |
| Aneurysm | 0.01 | 0.01 | 0.02 | 0.04 | 0.07 | 0.12 | 1100 |
| Acute myocardial infarction | 0.06 | 0.09 | 0.13 | 0.19 | 0.17 | 0.14 | 133 |
| Air and thrombotic embolism | 0.55 | 0.44 | 0.81 | 1.04 | 1.12 | 0.91 | 65 |
| Amniotic fluid embolism | 0.22 | 0.31 | 0.32 | 0.35 | 0.33 | 0.25 | 14 |
| Sickle cell disease crisis | . * | . * | .* | 0.51 | 0.52 | 0.51 | N/A |
| Severe anesthesia complications | 1.79 | 1.35 | 0.96 | 0.74 | 0.53 | 0.41 | -77 |
| Sepsis | 1.99 | 2.01 | 1.75 | 2.02 | 2.55 | 3.64 | 83 |
| Hysterectomy | 6.79 | 7.38 | 7.56 | 8.12 | 8.94 | 10.66 | 57 |
| Ventilation | 4.11 | 4.91 | 4.87 | 5.37 | 7.03 | 7.20 | 75 |
| Conversion of cardiac rhythm | 0.40 | 0.46 | 0.44 | 0.60 | 0.83 | 0.73 | 83 |
| Temporary tracheostomy | 0.23 | 0.26 | 0.22 | 0.17 | 0.32 | 0.21 | -9 |
| Blood transfusion | 25.99 | 32.71 | 47.16 | 77.30 | 106.41 | 120.44 | 363 |
| SMM with blood transfusions | 47.56 | 53.72 | 66.21 | 96.48 | 127.00 | 141.55 | 198 |
| SMM without blood transfusions | 25.05 | 25.67 | 25.37 | 28.47 | 31.84 | 34.33 | 37 |
*. Indicates small cell size
This table shows the rates of all 21 SMM indicators from 1993 through 2014 for 6 time periods (1993–1994, 1997–1998, 2001–2002, 2005–2006, 2009–2010, and 2013–2014) per 10,000 delivery hospitalizations.
Compared with the 1993–994 period, 13 SMM indicators had substantial (50% and more) rate increases in 2013–2014. The largest increases were among the following indicators:
- Acute renal failure at 369%.
- Blood transfusion at 363%.
- Shock (body is not getting adequate blood flow) at 233%.
- Adult respiratory distress syndrome at 189%.
- Cardiac arrest (sudden loss of heart function) or ventricular fibrillation (heart beats so quickly and irregularly that it stops pumping blood) at 158%.
- Acute myocardial infarction (heart attack) at 133%.
- Aneurysms of the aorta (balloon-like bulge in the body’s largest artery) at 1,110%.
Rates did not increase substantially or decreased among the following seven indicators:
- Acute congestive heart failure or pulmonary edema (heart muscle suddenly becomes weak and fluid builds up in the lungs).
- Amniotic fluid embolism (sudden onset of low blood pressure and/or arrest of heart function during labor or shortly after delivery).
- Eclampsia (high blood pressure and seizures during pregnancy).
- Puerperal cerebrovascular disorders (stroke).
- Heart failure or arrest (heart suddenly stops working) during surgery or procedure.
- Severe complications of anesthesia.
- Temporary tracheostomy (inserting a tube through the neck into the airway to help a patient breathe).
Severe Maternal Morbidity Indicators and Corresponding ICD Codes during Delivery Hospitalizations
The table below includes the list of 21 indicators and corresponding ICD codes used to identify delivery hospitalizations with SMM.
| Severe Maternal Morbidity Indicator | Diagnosis (DX) or Procedure (PR) | ICD–9 | ICD–10 | ICD–10 short |
|---|---|---|---|---|
| 1. Acute myocardial infarction | DX | 410.xx | I21.01, I21.02, I21.09, I21.11, I21.19, I21.21, I21.29, I21.3, I21.4, I22.0, I22.1, I22.2, I22.8, I22.9 | I21.xx, I22.x |
| 2. Acute renal failure | DX | 584.5, 584.6, 584.7, 584.8, 584.9, 669.3x | N17.0, N17.1, N17.2, N17.8, N17.9, O90.4 | N17.x, O90.4 |
| 3. Adult respiratory distress syndrome | DX | 518.5 (until September 2011) 518.51, 518.52, 518.53 * (since October 2011) 518.81 518.82 518.84 799.1 | J80, J95.1, J95.2, J95.3, J95.821, J95.822, J96.00, J96.01, J96.02, J96.20, J96.21, J96.22, R09.2 |
J80, J95.1, J95.2, J95.3, J95.82x, J96.0x, J96.2x R09.2 |
| 4. Amniotic fluid embolism | DX | 673.1x | O88.11x*, O88.12 (childbirth), O88.13 (puerperium) * x=1st, 2nd and 3rd trimester |
O88.1x |
| 5. Aneurysm | DX | 441.xx | I71.00 – I71.03, I71.1, I71.2, I71.3, I71.4, I71.5, I71.6, I71.8, I71.9, I79.0 | I71.xx* I79.0 *No I71.7 code exists, so ICD-10 list encompasses all possible I71 codes |
| 6. Cardiac arrest/ventricular fibrillation | DX | 427.41, 427.42*, 427.5 * Ventricular flutter |
I46.2, I46.8, I46.9, I49.01, I49.02*, * Ventricular flutter |
I46.x, I49.0x |
| 7. Disseminated intravascular coagulation | DX | 286.6, 286.9, 666.3x | D65, D68.8, D68.9, O72.3* *see comments for pregnancy related codes |
D65, D68.8, D68.9, O72.3 |
| 8. Eclampsia | DX | 642.6x | O15.02, O15.03, O15.1, O15.2
O14.22 – HELLP syndrome (HELLP), second trimester, O14.23 – HELLP syndrome (HELLP), third trimester |
O15.0x, O15.1, O15.2 |
| 9. Heart failure/arrest during surgery or procedure | DX | 669.4x, 997.1 | I97.120, I97.121, I97.130, I97.131 | I97.12x, I97.13x |
| 10. Puerperal cerebrovascular disorders | DX | 430, 431, 432.x, 433.xx, 434.xx, 436, 437.x, 671.5x, 674.0x, 997.02 | I60.0x-160.9, I61.0x-161.9, I62.0x, 162.1,162.9, I63.0x-163.9, I65.0x, 165.1, I65.2x, 165.8,165.9, I66.0x, 166.1x, I66.2x, 166.3, 166.8,166.9, 167.1, 167.2, 167.3, 167.4, 167.5, 167.6, 167.7, 167.8x, 167.9, 168.0, 160.8, 168.9 674.0x – no crosswalk |
I60.xx-I63.xx, I65.xx-I68.xx, O2251x, O873, I97.81x, I97.82x |
| 11. Pulmonary edema/acute heart failure | DX | 518.4, 428.1 | J81.0, I50.1, I50.20, I50.21, I50.23, I50.30, I50.31, I50.33, I50.40, I50.41, I50.43, I50.9 (-) Add 5th character: 0=unspecified 1=acute 2=chronic 3=acute on chronic 0=unspecified – keep since it is commonly used among health care providers terminology in medical records |
J81.0, I50.1, I50.20, I50.21, I50.23, I50.30, I50.31, I50.33, I50.40, I50.41, I50.43, I50.9 |
| 12. Severe anesthesia complications | DX | 668.0x*, 668.1x, 668.2x | 74.0 , O74.1, O74.2, O74.3, O89.01*, O89.09 O89.1, O89.2 *O89.01 Aspiration— decided to keep due to difficulties of separation from “Aspiration Pnuemonitis” |
O74.0 , O74.1 , O74.2, O74.3, O89.0x, O89.O89.2
|
| 13. Sepsis | DX | 038.xx, 995.91, 995.92, 670.2x (after October 1, 2009) | O85 or T80.211A or T81.4XXA plus A40.0, A40.1 , A40.3 , A40.8, A40.9, A41.0, A41.0Z1, A41.1, A41.2, A41.3, A41.4, A41.50, A41.51, A41.52, A41.53, A41.59, A41.81, A41.89, A41.9, A32.7 plus severity: R65.20 (or septic shock, see indicator “Shock”) |
O85 T80.211A T81.4XXA plus A40.x, A41.x, A32.7 plus R65.20 |
| 14. Shock | DX | 669.1x, 785.5x, 995.0, 995.4, 998.0x | O75.1, R57.0, R57.1, R57.8, R57.9, R65.21, T78.2XXA, T88.2XXA , T88.6XXA, T81.10XA, T81.11XA, T81.19XA | O75.1, R57.x, R65.21, T78.2XXA, T88.2 XXA, T88.6 XXA, T81.10XA , T81.11XA, T81.19XA |
| 15. Sickle cell disease with crisis | DX | 282.62, 282.64, 282.69 | D57.00 , D57.01, D57.02, D57.211, D57.212, D57.219, D57.411, D57.412, D57.419, D57.811, D57.812, D57.819 (5th digit: unspecified, acute chest syndrome or splenic sequestration) |
D57.0x, D57.21x, D57.41x, D57.81x |
| 16. Air and thrombotic embolism | DX | 415.1x, 673.0x, 673.2x 673.3x, 673.8x |
I26.01, I26.02, I26.09, I26.90, I26.92, I26.99 O88.011-O88.019, 088.02, O88.03, O88.211-O88.219, O88.22, O88.23, O88.311-O88.319, O88.32, O88.33, O88.81, O88.82, O88.83* I26.0 – Pulmonary embolism with acute cor pulmonale (acute right ventricle heart failure) |
I26.x, O88.0x, O88.2x, O88.3x, O88.8x
|
| 17. Blood transfusion | PR | 99.0x | 99.0x › 160 ICD-10-PCS codes The most common 30233N0, 30233P0, 30240N0, 30240P0, 30243N0, 30243P0 |
30233 Peripheral vein, percutaneous 30240 Central Vein, open 30243 Central Vein, percutaneous + Hx (whole blood) Kx (frozen plasma) Lx (fresh Plasma) Mx (plasma cryoprecipitate) Nx (red blood cells) Px (frozen Red cells) Rx (platelets) Tx (fibrinogen) 7th digit: x=0: autologous x=1: nonautologous |
| 18. Conversion of cardiac rhythm | PR | 99.6x | 5A2204Z, 5A12012 | 5A2204Z, 5A12012 |
| 19. Hysterectomy | PR | 68.3x-68.9 | 0UT90ZZ, 0UT94ZZ, 0UT97ZZ, 0UT98ZZ, 0UT9FZZ | 0UT90ZZ, 0UT94ZZ, 0UT97ZZ, 0UT98ZZ, 0UT9FZZ |
| 20. Temporary tracheostomy | PR | 31.1 | 0B110Z4, 0B110D4, 0B110F4, 0B113Z4, 0B113D4, 0B113F4, 0B114Z4, 0B114D4, 0B114F4 | 0B11x |
| 21. Ventilation | PR | 93.90, 96.01-96.05 Delete: 96.04, 96.7x |
5A1935Z, 5A1945Z, 5A1955Z |
5A1935Z, 5A1945Z, 5A1955Z |
- American College of Obstetricians and Gynecologists and the Society for Maternal–Fetal Medicine, Kilpatrick SK, Ecker JL. Severe maternal morbidity: screening and review . Am J Obstet Gynecol. 2016;215(3):B17–B22.
- Martin JA, Hamilton BE, Osterman MJK, Driscoll AK, Matthews TJ. Births: final data for 2015 [PDF – 1.63MB]. Nat Vital Stat Rep. 2017;66(1).
- Hinkle SN, Sharma AJ, Kim SY. Prepregnancy obesity trends among low-income women, United States, 1999–2008. Matern Child Health J. 2012;16(7):1339-1348.
- Fisher SC, Kim SY, Sharma AJ, Rochat R, Morrow R. Is obesity still increasing among pregnant women? Prepregnancy obesity trends in 20 states, 2003–2009. Prev Med. 2013;56(6):372-378.
- Campbell KH, Savitz D, Werner EF, Pettker CM, Goffman D, Chazotte C, Lipkind HS. Maternal morbidity and risk of death at delivery hospitalization. Obstet Gynecol. 2013;122(3):627–633.
- Small MJ, James AH, Kershaw T, Thames B, Gunatilake R, Brown H. Near-miss maternal mortality: cardiac dysfunction as the principal cause of obstetric intensive care unit admissions. Obstet Gynecol. 2012;119(2 Pt 1):250–255.
- Barber EL, Lundsberg LS, Belanger K, Pettker CM, Funai EF, Illuzzi JL. Indications contributing to the increasing cesarean delivery rate. Obstet Gynecol. 2011;118(1):29–38.
- Callaghan WM, Creanga AA, Kuklina EV. Severe maternal morbidity among delivery and postpartum hospitalizations in the United States. Obstet Gynecol. 2012;120(5):1029–1036.
- Page last reviewed: May 22, 2017
- Page last updated: May 22, 2017
- Content source: