

The CastCost Contraceptive Projection Tool
 ShareCompartir
Based on many years of experience providing contraceptive logistics assistance and conducting population-based reproductive health surveys, CDC’s Division of Reproductive Health developed a tool for quickly producing projections of a country or program’s contraceptive needs. Known as the Contraceptive Forecast and Cost Estimate Spreadsheet, or CastCost, this tool was developed with support from the U.S. Agency for International Development.
This user-friendly tool provides an estimate of contraceptive quantities that will be needed for the next five years and how much they will cost. It can be used for a country as a whole or for different sectors (public or private) or for providers.
CastCost can also be used to—
- Make budget projections.
- Validate logistics-based contraceptive forecasts.
- Determine contraceptive needs as part of a contraceptive security exercise.
- Test cost and procurement scenarios for different contraceptive method mixes or supply sources (donors or manufacturers).
CastCost is a series of linked Excel spreadsheets. Instructions are embedded in the spreadsheet and provided in a User’s Manual. CastCost produces detailed reports for program, policy, and logistics staff, and a summary report for policymakers. It also provides graphs of past trends in contraceptive use for each method to help the user estimate future prevalence.
CastCost is available in English and en Español (Spanish).
Persons with disabilities experiencing problems accessing this page should contact CDC-INFO at CDC-INFO@cdc.gov, 800-232-4636 or the TTY number at (888) 232-6348 and ask for a 508 Accommodation PR#9342. If emailing, please type “508 Accommodation PR#9342” without quotes in the subject line of the email.
Data Requirements
CastCost requires the following data, which are easily obtained from Web sites and survey reports:
- Number of women of reproductive age in the country can be obtained from the U.S. Census Bureau’s Web site.
- Annual rate of population increase can be obtained from the U.S. Census Bureau’s Web site.
- Percentage of women who are married or in less formal unions from Reproductive Health Surveys or Demographic and Health Surveys.
- Percentage of women in union who currently use contraceptives, by method (from Reproductive Health Surveys or Demographic and Health Surveys, including data from past surveys, if any.
- Source of users’ contraceptive supply, by method from Reproductive Health Surveys or Demographic and Health Surveys.
- Estimates of contraceptive prevalence by method five years from the start of the projection (projection offered by CastCost and adjusted and entered by the user).
In most cases, the survey data can be obtained from the STATCompiler Web site. Reproductive Health Survey data sets can be obtained from the Global Health Data Exchange.
If the country has conducted a male survey, then data on the number of reproductive age men and information on condom use and supply source can also be entered to produce a more precise projection of condom needs.
The CastCost spreadsheet helps you answer, “How many units of each contraceptive does my program need for its clients, and how much will they cost?”
Graphs
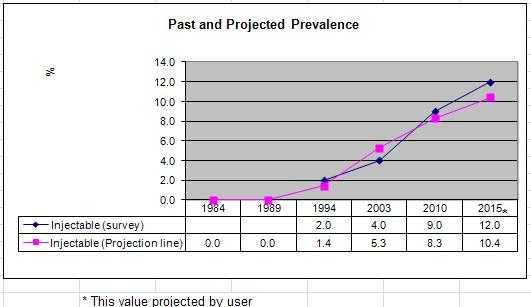
CastCost produces graphs of trends in contraceptive prevalence, using data from current and previous surveys, for each contraceptive method to assist the user in estimating what the prevalence will be five years into the future (blue line). It also provides a “best-fitting” trend line of these data to indicate possible future direction (pink line).
CastCost produces graphs of trends in contraceptive prevalence, using data from current and previous surveys, for each contraceptive method to assist the user in estimating what the prevalence will be five years into the future (blue line). It also provides a “best-fitting” trend line of these data to indicate possible future direction (pink line).
Reports
CastCost produces the following reports:
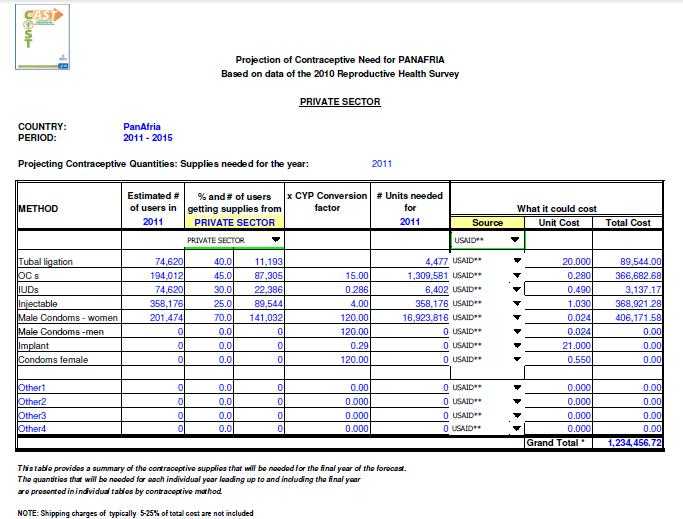
- Estimation Summary shows the number of units that will be needed for each contraceptive method and the cost in five tables, one table for each year of the projection. It also includes details on the number of users of each method, and the percentage of users getting supplies from the source or provider that is the focus of that report. You may select different procurement sources and prices in this report.
-
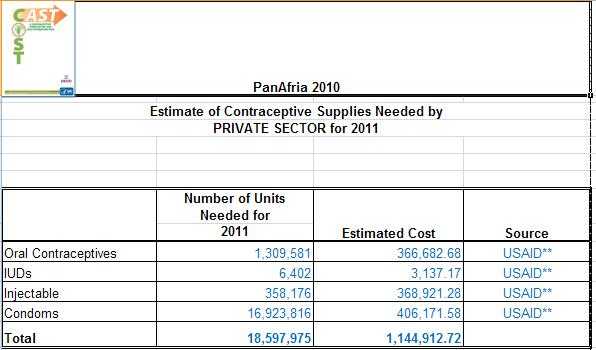
- Policy maker’s Summary is a simplified version of the Estimation Summary that lists just the quantities and costs, one table for each year of the projection.
-
- Estimation by Method provides the same information as the Estimation Summary, but just for one method, with all 5 years of the projection in one table.
Additional Features
CastCost also provides—- A table to help procurement staff calculate the quantities of contraceptives to order.
- The ability to change the Couple-Year of Protection (CYP) factors used in making the estimates if local data indicate a different rate of usage (e.g., for condoms) or average length of protection (e.g., for sterilization).
- Tables that show the calculations supporting the estimates.
Troubleshooting Tips
Why do I get an error message when opening CastCost?
If you use MS Excel 2007, when you open CastCost, go to the Menu page. Near the top of the left hand corner is a message that says “Security Warning: Macros have been disabled.”
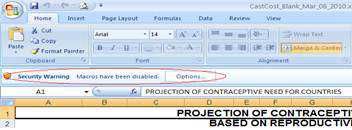
Click on “Options” and then select “Enable this content” and then “OK.” The security warning will disappear.
If you open Excel 2003, and then open CastCost and get the following message:
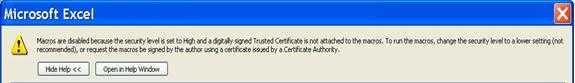
This means your Macro Security Level is set too high. You need to close CastCost and go to the Tools menu. Point to Macro, and then click Security. Click on Medium. Click OK. Then open the Spreadsheet again, and you should get the message about enabling Macros. Click on Enable Macros.
Why do I have incomplete graphs (no lines for historical data)?
On the Data Entry page, make sure you have entered the year of the surveys at the top of the columns of historical prevalence data. If no years have been entered, the default data points remain on the x axis.
Note: You must enter data into the red “Projected Values” column for the graphs to work; it will not use its own calculated projected values (blue column) for the graphs.
The calculated value column is empty or no pink lines show on the graphs.
Go to the Data Entry page and check how you have entered the historical data. It is very likely that you have less than four years of historical data, but have entered the data in the columns furthest to the left, and the third and fourth columns are empty. The way the spreadsheet is set up, you need to work from the Current Survey column to the left, going back in time. Thus, if you have data from only one earlier survey, you should enter it in the fourth column, immediately to the left of the Current Survey column. If you have data from two past surveys, you should enter them in the third and fourth columns, with the older data in the third column. If you have data from three past surveys, use the second, third, and fourth columns, with the earliest data in the second column, etc.
How do I enter a contraceptive method that is not listed?
To enter a new method, go first to the Data Entry page and scroll down to the Contraceptive Prevalence section. There are several rows beneath the Implant row that are shaded and labeled Other 1, 2, 3, etc. Select one of these cells, and type in the contraceptive method you would like to add. You will now find that this method appears in all the other tables: Data Entry/Source of Contraceptive; Cost Options & CYP; Background Data; Estimation Summary; and there is an individual report for that method (the blue tab at the bottom will still read Other 1, 2, etc., but the method name will appear on the report).
How do I enter two brands or formulations of one contraceptive method?
You can always add a second kind of pill, injectable, IUD, etc. by entering it into one of the “Other” lines on the Data Entry page under Contraceptive Prevalence, and it will then appear in all the other tables.
However, most surveys do not report on specific brands in their method categories, so please note that if that second kind of pill etc. is not also on the survey questionnaire, you will not have the necessary data on the prevalence of its use and where users obtain it (source). You would have to estimate those percentages, which would make your whole estimate less accurate.
There is a lack of data on source of supply (for a rough estimate).
Go to the Source of Contraceptive section of the Data Entry page, and enter “100” (for 100%) in each column along one row (for example, line a, the first line under Public Sector). Then select that row in the pull down menu, or select Total Sources. The report will then show you the quantities needed and the cost for 100% of users (the same as it would for Total Sources if you had source data).
There is a lack of data in the survey on source of supply for a low-use method.
Surveys collect source information for all contraceptive methods, but may not publish them if the usage is very low. To obtain the data, contact the organization that conducted (or provided technical assistance to) the survey (usually CDC for Reproductive Health Survey or ICF/Macro for Demographic and Health Surveys) and request the data.
If the method is so little used, it may not be worth the effort of contacting the survey assistance organization. If you choose not to get the source data, then in the Source table on the Data Entry page, enter “100” [%] on one of the lines (in whichever is the likeliest sector, Public or Private) and you will still get quantity and cost information when you generate the estimate for Total Sources or for that sector.
Note: If prevalence of a method is very low, it may not be accurately picked up by a survey. It may be a method favored by a small sub-population (such as commercial sex workers), and therefore figures for the population as a whole— including source figures —may be misleading. If this is the case, you may wish to consider using other data sources or criteria for determining appropriate quantities.
The methods are grouped together in the survey data.
On occasion, survey reports or the DHS Statcompiler will combine the prevalence rates for several little-used methods into one rate. Methods cannot be combined in CastCost because they all have different CYP factors, so calculating the needed quantities — which is done using CYP factors —would be impossible. Therefore, if you want to do an estimate for those methods, you will have to obtain the disaggregated data (e.g., separate prevalence rates for each method). If the data come from a Reproductive Health Survey, then e-mail drhinfo@cdc.gov to request the data you need. If they come from a Demographic and Health Survey, e-mail your request to info@measuredhs.com.
Note: Remember, when you add methods to CastCost (in the “Other” boxes), you also need to go to the “Cost Options & CYP” tab and add their cost (price) information and their CYP factors.
I select a different source for a report (e.g., Ministry of Health) but the numbers don’t change.
If you are using Windows 2007, then the problem is with the security setting of the Macros. Go to the Menu page, and near the upper left corner is a message that says “Security Warning Macros have been disabled.” Click on “Options” and then select “Enable this content” and then “OK.” The security warning will disappear.
- Page last reviewed: July 15, 2015
- Page last updated: December 14, 2016
- Content source: