Reference ranges for blood tests
Reference ranges for blood tests are sets of values used by a health professional to interpret a set of medical test results from blood samples.
| Reference ranges |
|---|
|
In: |
Reference ranges for blood tests are studied within the field of clinical chemistry (also known as "clinical biochemistry", "chemical pathology" or "pure blood chemistry"), the area of pathology that is generally concerned with analysis of bodily fluids.
Blood test results should always be interpreted using the reference range provided by the laboratory that performed the test.[1]
Interpretation
A reference range is usually defined as the set of values 95 percent of the normal population falls within (that is, 95% prediction interval).[2] It is determined by collecting data from vast numbers of laboratory tests.
Plasma or whole blood
In this article, all values (except the ones listed below) denote blood plasma concentration, which is approximately 60–100% larger than the actual blood concentration if the amount inside red blood cells (RBCs) is negligible. The precise factor depends on hematocrit as well as amount inside RBCs. Exceptions are mainly those values that denote total blood concentration, and in this article they are:
- All values in Hematology – red blood cells (except hemoglobin in plasma)
- All values in Hematology – white blood cells
- Platelet count (Plt)
A few values are for inside red blood cells only:
- Vitamin B9 (folic acid/folate) in red blood cells
- Mean corpuscular hemoglobin concentration (MCHC)
Units
- Mass concentration (g/dL or g/L) is the most common measurement unit in the United States. Is usually given with dL (decilitres) as the denominator in the United States, and usually with L (litres) in, for example, Sweden.
- Molar concentration (mol/L) is used to a higher degree in most of the rest of the world, including the United Kingdom and other parts of Europe and Australia and New Zealand.[3]
- International units (IU) are based on measured biological activity or effect, or for some substances, a specified equivalent mass.
- Enzyme activity (kat) is commonly used for e.g. liver function tests like AST, ALT, LD and γ-GT in Sweden.[4]
- Percentages and time-dependent units (mol/s) are used for calculated derived parameters, e.g. for beta cell function in homeostasis model assessment or thyroid's secretory capacity.
Arterial or venous
If not otherwise specified, a reference range for a blood test is generally the venous range, as the standard process of obtaining a sample is by venipuncture. An exception is for acid-base and blood gases, which are generally given for arterial blood.
Still, the blood values are approximately equal between the arterial and venous sides for most substances, with the exception of acid-base, blood gases and drugs (used in therapeutic drug monitoring (TDM) assays).[5] Arterial levels for drugs are generally higher than venous levels because of extraction while passing through tissues.[5]
Usual or optimal
Reference ranges are usually given as what are the usual (or normal) values found in the population, more specifically the prediction interval that 95% of the population fall into. This may also be called standard range. In contrast, optimal (health) range or therapeutic target is a reference range or limit that is based on concentrations or levels that are associated with optimal health or minimal risk of related complications and diseases. For most substances presented, the optimal levels are the ones normally found in the population as well. More specifically, optimal levels are generally close to a central tendency of the values found in the population. However, usual and optimal levels may differ substantially, most notably among vitamins and blood lipids, so these tables give limits on both standard and optimal (or target) ranges.
In addition, some values, including troponin I and brain natriuretic peptide, are given as the estimated appropriate cutoffs to distinguish healthy people from people with specific conditions, which here are myocardial infarction and congestive heart failure, respectively, for the aforementioned substances.
Variability
References range may vary with age, sex, race, pregnancy,[6] diet, use of prescribed or herbal drugs and stress. Reference ranges often depend on the analytical method used, for reasons such as inaccuracy, lack of standardisation, lack of certified reference material and differing antibody reactivity.[7] Also, reference ranges may be inaccurate when the reference groups used to establish the ranges are small.
Sorted by concentration
By units
Units don't necessarily imply anything about molarity or mass.
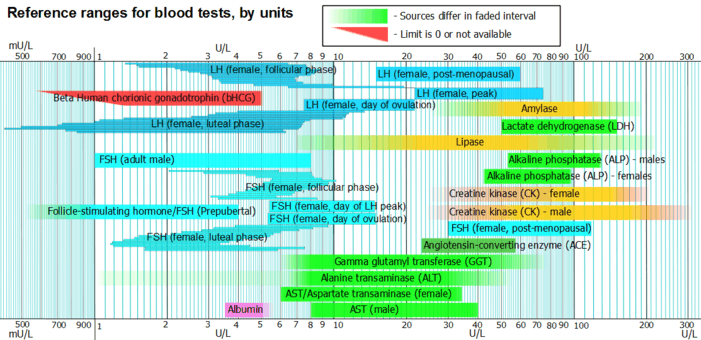
A few substances are below this main interval, e.g. thyroid stimulating hormone, being measured in mU/L, or above, like rheumatoid factor and CA19-9, being measured in U/mL.
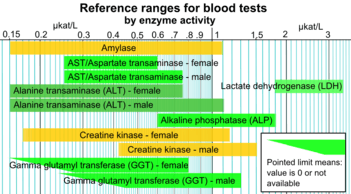
By enzyme activity
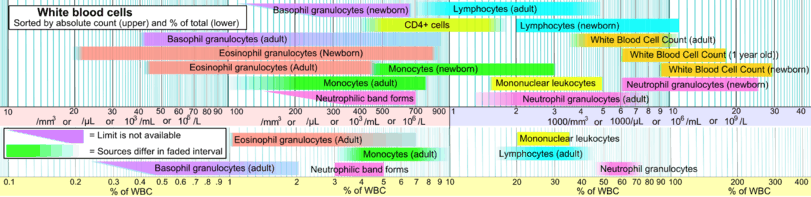
White blood cells
Sorted by category
Ions and trace metals
Included here are also related binding proteins, like ferritin and transferrin for iron, and ceruloplasmin for copper.
| Test | Lower limit | Upper limit | Unit* | Comments |
|---|---|---|---|---|
| Sodium (Na) | 135,[9] 137[4][10] | 145,[4][10] 147[9] | mmol/L or mEq/L[9] | See hyponatremia or hypernatremia |
| 310,[11] 320[11] | 330,[11] 340[11] | mg/dL | ||
| Potassium (K) | 3.5,[4][9] 3.6[10] | 5.0,[4][9][10] 5.1 | mmol/L or mEq/L[9] | See hypokalemia or hyperkalemia |
| 14[12] | 20[12] | mg/dL | ||
| Chloride (Cl) | 95,[9] 98,[13] 100[4] | 105,[9] 106,[13] 110[4] | mmol/L or mEq/L[9] | See hypochloremia or hyperchloremia |
| 340[14] | 370[14] | mg/dL | ||
| Ionized calcium (Ca) | 1.03,[15] 1.10[4] | 1.23,[15] 1.30[4] | mmol/L | See hypocalcaemia or hypercalcaemia |
| 4.1,[16] 4.4[16] | 4.9,[16] 5.2[16] | mg/dL | ||
| Total calcium (Ca) | 2.1,[9][17] 2.2[4] | 2.5,[4][17] 2.6,[17] 2.8[9] | mmol/L | |
| 8.4,[9] 8.5[18] | 10.2,[9] 10.5[18] | mg/dL | ||
| Total serum iron (TSI) – male | 65,[19] 76[10] | 176,[19] 198[10] | µg/dL | See hypoferremia or the following: iron overload (hemochromatosis), iron poisoning, siderosis, hemosiderosis, hyperferremia |
| 11.6,[20][21] 13.6[21] | 30,[20] 32,[21] 35[21] | μmol/L | ||
| Total serum iron (TSI) – female | 26,[10] 50[19] | 170[10][19] | µg/dL | |
| 4.6,[21] 8.9[20] | 30.4[20] | μmol/L | ||
| Total serum iron (TSI) – newborns | 100[19] | 250[19] | µg/dL | |
| 18[21] | 45[21] | µmol/L | ||
| Total serum iron (TSI) – children | 50[19] | 120[19] | µg/dL | |
| 9[21] | 21[21] | µmol/L | ||
| Total iron-binding capacity (TIBC) | 240,[19] 262[10] | 450,[19] 474[10] | μg/dL | |
| 43,[21] 47[21] | 81,[21] 85[21] | µmol/L | ||
| Transferrin | 190,[22] 194,[4] 204[10] | 326,[4] 330,[22] 360[10] | mg/dL | |
| 25[23] | 45[23] | μmol/L | ||
| Transferrin saturation | 20[19] | 50[19] | % | |
| Ferritin – Males and postmenopausal females | 12[24] | 300[24][25] | ng/mL or µg/L | |
| 27[26] | 670[26] | pmol/L | ||
| Ferritin – premenopausal females | 12[24] | 150[24] – 200[25] | ng/mL or µg/L | |
| 27[26] | 330[26] – 440[26] | pmol/L | ||
| Ammonia | 10,[27] 20[28] | 35,[27] 65[28] | μmol/L | See hypoammonemia and hyperammonemia |
| 17,[29] 34[29] | 60,[29] 110[29] | μg/dL | ||
| Copper (Cu) | 70[18] | 150[18] | µg/dL | See hypocupremia or hypercupremia |
| 11[30][31] | 24[30] | μmol/L | ||
| Ceruloplasmin | 15[18] | 60[18] | mg/dL | |
| 1[32] | 4[32] | μmol/L | ||
| Phosphate (HPO42−) | 0.8 | 1.5[33] | mmol/L | See hypophosphatemia or hyperphosphatemia |
| Inorganic phosphorus (serum) | 1.0[9] | 1.5[9] | mmol/L | |
| 3.0[9] | 4.5[9] | mg/dL | ||
| Zinc (Zn) | 60,[34] 72[35] | 110,[35] 130[34] | μg/dL | See zinc deficiency or zinc poisoning |
| 9.2,[36] 11[4] | 17,[4] 20[36] | µmol/L | ||
| Magnesium | 1.5,[18] 1.7[37] | 2.0,[18] 2.3[37] | mEq/L or mg/dL | See hypomagnesemia or hypermagnesemia |
| 0.6,[38] 0.7[4] | 0.82,[38] 0.95[4] | mmol/L | ||
- Note: Although 'mEq' for mass and 'mEq/L' are sometimes used in the US and elsewhere, they are not part of SI and are now considered redundant.
Acid-base and blood gases
If arterial/venous is not specified for an acid-base or blood gas value, then it generally refers to arterial, and not venous which otherwise is standard for other blood tests.
Acid-base and blood gases are among the few blood constituents that exhibit substantial difference between arterial and venous values.[5] Still, pH, bicarbonate and base excess show a high level of inter-method reliability between arterial and venous tests, so arterial and venous values are roughly equivalent for these.[39]
| Test | Arterial/Venous | Lower limit | Upper limit | Unit |
|---|---|---|---|---|
| pH | Arterial | 7.34,[10] 7.35[9] | 7.44,[10] 7.45[9] | |
| Venous | 7.31[40] | 7.41[40] | ||
| [H+] | Arterial | 36[9] | 44[9] | nmol/L |
| 3.6[41] | 4.4[41] | ng/dL | ||
| Base excess | Arterial & venous[40] | −3[40] | +3[40] | mEq/L |
| Oxygen partial pressure (pO2) | Arterial pO2 | 10,[9] 11[42] | 13,[42] 14[9] | kPa |
| 75,[9][10] 83[18] | 100,[10] 105[9] | mmHg or torr | ||
| Venous | 4.0[42] | 5.3[42] | kPa | |
| 30[40] | 40[40] | mmHg or torr | ||
| Oxygen saturation | Arterial | 94,[40] 95,[13] 96[18] | 100[13][18] | % |
| Venous | Approximately 75[13] | |||
| Carbon dioxide partial pressure (pCO2) | Arterial PaCO2 | 4.4,[9] 4.7[42] | 5.9,[9] 6.0[42] | kPa |
| 33,[9] 35[10] | 44,[9] 45[10] | mmHg or torr | ||
| Venous | 5.5,[42] | 6.8[42] | kPa | |
| 41[40] | 51[40] | mmHg or torr | ||
| Absolute content of carbon dioxide (CO2) | Arterial | 23[40] | 30[40] | mmol/L |
| 100[43] | 132[43] | mg/dL | ||
| Bicarbonate (HCO3−) | Arterial & venous | 18[18] | 23[18] | mmol/L |
| 110[44] | 140[44] | mg/dL | ||
| Standard bicarbonate (SBCe) | Arterial & venous | 21, 22[9] | 27, 28[9] | mmol/L or mEq/L[9] |
| 134[44] | 170[44] | mg/dL | ||
Liver function
| Test | Patient type | Lower limit | Upper limit | Unit | Comments |
|---|---|---|---|---|---|
| Total protein (TotPro) | 60,[9] 63[10] | 78,[9] 82,[10] 84[18] | g/L | See serum total protein Interpretation | |
| Albumin | 35[9][45] | 48,[10] 55[9] | g/L | See hypoalbuminemia | |
| 3.5[10] | 4.8,[10] 5.5[9] | U/L | |||
| 540[46] | 740[46] | μmol/L | |||
| Globulins | 23[9] | 35[9] | g/L | ||
| Total bilirubin | 1.7,[47] 2,[9] 3.4,[47] 5[4] | 17,[9][47] 22,[47] 25[4] | μmol/L | ||
| 0.1,[9] 0.2,[10] 0.29[48] | 1.0,[9][18] 1.3,[10] 1.4[48] | mg/dL | |||
| Direct/conjugated bilirubin | 0.0[9] or N/A[4] | 5,[9] 7[4][47] | μmol/L | ||
| 0[9][10] | 0.3,[9][10] 0.4[18] | mg/dL | |||
| Alanine transaminase (ALT/ALAT[4]) | 5,[49] 7,[10] 8[9] | 20,[9] 21,[13] 56[10] | U/L | Also called serum glutamic pyruvic transaminase (SGPT) | |
| Female | 0.15[4] | 0.75[4] | µkat/L | ||
| Male | 0.15[4] | 1.1[4] | |||
| Aspartate transaminase (AST/ASAT[4]) | Female | 6[50] | 34[50] | IU/L | Also called serum glutamic oxaloacetic transaminase (SGOT) |
| 0.25[4] | 0.60[4] | µkat/L | |||
| Male | 8[50] | 40[50] | IU/L | ||
| 0.25[4] | 0.75[4] | µkat/L | |||
| Alkaline phosphatase (ALP) | 0.6[4] | 1.8[4] | µkat/L | ||
| Female | 42[49] | 98[49] | U/L | ||
| Male | 53[49] | 128[49] | |||
| Gamma glutamyl transferase (GGT) | 5,[49] 8[10] | 40,[49] 78[10] | U/L | ||
| Female | 0.63[51] | µkat/L | |||
| Male | 0.92[51] | µkat/L | |||
Cardiac tests
| Test | Patient type | Lower limit | Upper limit | Unit | Comments |
|---|---|---|---|---|---|
| Creatine kinase (CK) | Male | 24,[52] 38,[10] 60[49] | 174,[18] 320[49] | U/L or ng/mL | |
| 0.42[53] | 1.5[53] | µkat/L | |||
| Female | 24,[52] 38,[10] 96[18] | 140,[18] 200[49] | U/L or ng/mL | ||
| 0.17[53] | 1.17[53] | µkat/L | |||
| CK-MB | 0 | 3,[10] 3.8,[4] 5[49] | ng/mL or μg/L[4] | ||
| Myoglobin | Female | 1[54] | 66[54] | ng/mL or µg/L | |
| Male | 17[54] | 106[54] | |||
| Cardiac troponin T | 0.01[55] | ng/mL | 99th percentile cutoff |
| Brain natriuretic peptide (BNP) | |
| Interpretation | Range / Cutoff |
|---|---|
| Congestive heart failure unlikely | < 100 pg/mL[56][57] |
| "Gray zone" | 100-500 pg/mL[56][57] |
| Congestive heart failure likely | >500 pg/mL[56][57] |
| NT-proBNP | ||
| Interpretation | Age | Cutoff |
|---|---|---|
| Congestive heart failure likely | < 75 years | > 125 pg/mL[58] |
| >75 years | >450pg/mL[58] | |
Lipids
| Test | Patient type | Lower limit | Upper limit | Unit | Therapeutic target |
|---|---|---|---|---|---|
| Triglycerides | 10–39 years | 54[18] | 110[18] | mg/dL | < 100 mg/dL[59] or 1.1[59] mmol/L |
| 0.61[60] | 1.2[60] | mmol/L | |||
| 40–59 years | 70[18] | 150[18] | mg/dL | ||
| 0.77[60] | 1.7[60] | mmol/L | |||
| > 60 years | 80[18] | 150[18] | mg/dL | ||
| 0.9[60] | 1.7[60] | mmol/L | |||
| Total cholesterol | 3.0,[61] 3.6[9][61] | 5.0,[4][62] 6.5[9] | mmol/L | < 3.9 mmol/L[59] | |
| 120,[10] 140[9] | 200,[10] 250[9] | mg/dL | < 150 mg/dL[59] | ||
| HDL cholesterol | Female | 1.0,[63] 1.2,[4] 1.3[61] | 2.2[63] | mmol/L | > 1.0[63] or 1.6[61] mmol/L 40[64] or 60[65] mg/dL |
| 40,[64] 50[66] | 86[64] | mg/dL | |||
| HDL cholesterol | Male | 0.9[4][63] | 2.0[63] | mmol/L | |
| 35[64] | 80[64] | mg/dL | |||
| LDL cholesterol (Not valid when triglycerides >5.0 mmol/L) | 2.0,[63] 2.4[62] | 3.0,[4][62] 3.4[63] | mmol/L | < 2.5 mmol/L[63] | |
| 80,[64] 94[64] | 120,[64] 130[64] | mg/dL | < 100 mg/dL[64] | ||
| LDL/HDL quotient | n/a | 5[4] | (unitless) |
Tumour markers
| Test | Patient type | Cutoff | Unit | Comments |
|---|---|---|---|---|
| Alpha fetoprotein (AFP) | 44[10] | ng/mL or µg/L | Hepatocellular carcinoma or testicular cancer | |
| Beta human chorionic gonadotrophin (bHCG) | In males and non-pregnant females | 5[10] | IU/l or mU/mL | choriocarcinoma |
| CA19-9 | 40[10] | U/mL | Pancreatic cancer | |
| CA-125 | 30,[67] 35[68] | kU/L or U/mL | ||
| Carcinoembryonic antigen (CEA) | Non-smokers, 50 years | 3.4,[4] 3.6[69] | μg/L | |
| Non-smokers, 70 years | 4.1[69] | |||
| Smokers | 5[70] | |||
| Prostate specific antigen (PSA) | 40-49 years | 1.2 - 2.9[71] | μg/L[4][10] or ng/mL[18] | More detailed cutoffs in PSA - Serum levels |
| 70-79 years, non-African-American | 4.0 - 9.0[71] | |||
| 70-79 years, African-American | 7.7 - 13[71] | |||
| PAP | 3[18] | units/dL (Bodansky units) | ||
| Calcitonin | 5,[72] 15[72] | ng/L or pg/mL | Cutoff against medullary thyroid cancer[72] More detailed cutoffs in Calcitonin article |
Endocrinology
Thyroid hormones
| Test | Patient type | Lower limit | Upper limit | Unit |
|---|---|---|---|---|
| Thyroid stimulating hormone (TSH or thyrotropin) | Adults – standard range | 0.3,[4] 0.4,[10] 0.5,[18] 0.6[73] | 4.0,[4] 4.5,[10] 6.0[18] | mIU/L or μIU/mL |
| Adults – optimal range | 0.3,[74] 0.5[75] | 2.0,[75] 3.0[74] | ||
| Infants | 1.3[76] | 19[76] | ||
| Free thyroxine (FT4) | Normal adult | 0.7,[77] 0.8[10] | 1.4,[77] 1.5,[10] 1.8[78] | ng/dL |
| 9,[4][79] 10,[80] 12[81] | 18,[4][79] 23[81] | pmol/L | ||
| Child/Adolescent 31 d – 18 y | 0.8[77] | 2.0[77] | ng/dL | |
| 10[79] | 26[79] | pmol/L | ||
| Pregnant | 0.5[77] | 1.0[77] | ng/dL | |
| 6.5[79] | 13[79] | pmol/L | ||
| Total thyroxine | 4,[80] 5.5[10] | 11,[80] 12.3[10] | μg/dL | |
| 60[80][81] | 140,[80] 160[81] | nmol/L | ||
| Free triiodothyronine (FT3) | Normal adult | 0.2[80] | 0.5[80] | ng/dL |
| 3.1[82] | 7.7[82] | pmol/L | ||
| Children 2-16 y | 0.1[83] | 0.6[83] | ng/dL | |
| 1.5[82] | 9.2[82] | pmol/L | ||
| Total triiodothyronine | 60,[10] 75[80] | 175,[80] 181[10] | ng/dL | |
| 0.9,[4] 1.1[80] | 2.5,[4] 2.7[80] | nmol/L | ||
| Thyroxine-binding globulin (TBG) | 12[10] | 30[10] | mg/L | |
| Thyroglobulin (Tg) | 1.5[80] | 30[80] | pmol/L | |
| 1[80] | 20[80] | μg/L | ||
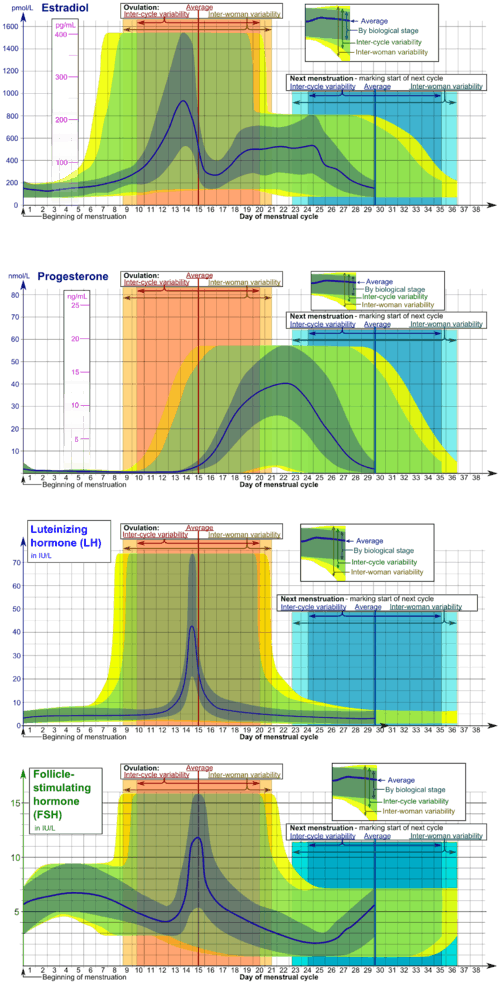
Sex hormones
The diagrams below take inter-cycle and inter-woman variability into account in displaying reference ranges for estradiol, progesterone, FSH and LH.
| Test | Patient type | Lower limit | Upper limit | Unit |
|---|---|---|---|---|
| Dihydrotestosterone | adult male | 30[85] | 85[85] | ng/dL |
| Testosterone | Male, overall | 8,[86] 10[87] | 27,[86] 35[87] | nmol/L |
| 230,[88] 300[89] | 780[88] – 1000[89] | ng/dL | ||
| Male < 50 years | 10[4] | 45[4] | nmol/L | |
| 290[88] | 1300[88] | ng/dL | ||
| Male > 50 years | 6.2[4] | 26[4] | nmol/L | |
| 180[88] | 740[88] | ng/dL | ||
| Female | 0.7[87] | 2.8[87] – 3.0[4] | nmol/L | |
| 20[89] | 80[89] – 85[88] | ng/dL | ||
| 17α-Hydroxyprogesterone | male | 0.06[18] | 3.0[18] | mg/L |
| 0.18[90] | 9.1[90] | µmol/l | ||
| Female (Follicular phase) | 0.2[18] | 1.0[18] | mg/L | |
| 0.6[90] | 3.0[90] | µmol/l | ||
| Follicle-stimulating hormone (FSH) | Prepubertal | <1[91] | 3[91] | IU/L |
| Adult male | 1[91] | 8[91] | ||
| Adult female (follicular and luteal phase) | 1[91] | 11[91] | ||
| Adult female (Ovulation) | 6[91] 95% PI (standard) | 26[91] 95% PI) | ||
| 5[92] 90% PI (used in diagram) | 15[92] (90% PI) | |||
| Post-menopausal female | 30[91] | 118[91] | ||
| Luteinizing hormone (LH) | Female, peak | 20[92] 90% PI (used in diagram) | 75[92] (90% PI) | IU/L |
| Female, post-menopausal | 15[93] | 60[93] | ||
| Male aged 18+ | 2[94] | 9[94] | ||
| Estradiol (an estrogen) | Adult male | 50[95] | 200[95] | pmol/L |
| 14[96] | 55[96] | pg/mL | ||
| Adult female (day 5 of follicular phase, and luteal phase) | 70[95] | 500,[95] 600[95] | pmol/L | |
| 19[96] | 140,[96] 160[96] | pg/mL | ||
| Adult female – free (not protein bound) | 0.5[97] | 9[97] | pg/mL | |
| 1.7[97] | 33[97] | pmol/L | ||
| Post-menopausal female | N/A[95] | < 130[95] | pmol/L | |
| N/A[96] | < 35[96] | pg/mL | ||
| Progesterone | Female in mid-luteal phase (day 21-23) | 17,[92] 35[98] | 92[98] | nmol/L |
| 6,[92] 11[99] | 29[99] | ng/mL | ||
| Androstenedione | Adult male and female | 60[93] | 270[93] | ng/dL |
| Post-menopausal female | < 180[93] | |||
| Prepubertal | < 60[93] | |||
| Dehydroepiandrosterone sulfate | Adult male and female | 30[100] | 400[100] | µg/dL |
| SHBG | Adult female | 40[101] | 120[101] | nmol/L |
| Adult male | 20[101] | 60[101] | ||
| Anti-Müllerian hormone (AMH) | 13–45 years | 0.7[102] | 20[102] | ng/mL |
| 5[103] | 140[103] | pmol/l |
Other hormones
| Test | Patient type | Lower limit | Upper limit | Unit |
|---|---|---|---|---|
| Adrenocorticotropic hormone (ACTH) | 4.4[104] | 18,[105] 22[104] | pmol/L | |
| 20[10] | 80,[106] 100[10] | pg/mL | ||
| Cortisol | 09:00 am | 140[107] | 700[107] | nmol/L |
| 5[108] | 25[108] | μg/dL | ||
| Midnight | 80[107] | 350[107] | nmol/L | |
| 2.9[108] | 13[108] | μg/dL | ||
| Growth hormone (fasting) | 0 | 5[9] | ng/mL | |
| Growth hormone (arginine stimulation) | 7[9] | n/a | ng/mL | |
| IGF-1 | Female, 20 yrs | 110[109] | 420[109] | ng/mL |
| Female, 75 yrs | 55[109] | 220[109] | ||
| Male, 20 yrs | 160[109] | 390[109] | ||
| Male, 75 yrs | 48[109] | 200[109] | ||
| Prolactin | Female | 71,[110] 105[110] | 348,[110] 548[110] | mIU/L |
| 3.4,[110] 3.9[110] | 16.4,[110] 20.3[110] | µg/L | ||
| Male | 58,[110] 89[110] | 277,[110] 365[110] | mIU/L | |
| 2.7,[110] 3.3[110] | 13.0,[110] 13.5[110] | µg/L | ||
| Parathyroid hormone (PTH) | 10,[111] 17[112] | 65,[111] 70[112] | pg/mL | |
| 1.1,[4] 1.8[113] | 6.9,[4] 7.5[113] | pmol/L | ||
| 25-hydroxycholecalciferol (a vitamin D) – Standard reference range | 8,[18][114] 9[114] | 40,[114] 80[18] | ng/mL | |
| 20,[115] 23[116] | 95,[116] 150[115] | nmol/L | ||
| 25-hydroxycholecalciferol – Therapeutic target range | 30,[117] 40[118] | 65,[118] 100[117] | ng/mL | |
| 85,[59] 100[118] | 120,[59] 160[118] | nmol/L | ||
| Plasma renin activity | 0.29,[119] 1.9[120] | 3.7[119][120] | ng/(mL·h) | |
| 3.3,[121] 21[122] | 41[121][122] | mcU/mL | ||
| Aldosterone | Adult | 19,[121] 34.0[121] | ng/dL | |
| 530,[123] 940[123] | pmol/L | |||
| Aldosterone-to-renin ratio | Adult | 13.1,[124] 35.0[124] | ng/dl per ng/(mL·h) | |
| 360,[124] 970[124] | pmol/liter per µg/(L·h) |
Vitamins
Also including the vitamin B12)-related amino acid homocysteine.
| Test | Patient type | Standard range | Optimal range | Unit | ||
|---|---|---|---|---|---|---|
| Lower limit | Upper limit | Lower limit | Upper limit | |||
| Vitamin A | 30[18] | 65[18] | µg/dL | |||
| Vitamin B9 (Folic acid/Folate) – Serum | Age > 1 year | 3.0[125] | 16[125] | 5[126] | ng/mL or μg/L | |
| 6.8[127] | 36[127] | 11[127] | nmol/L | |||
| Vitamin B9 (Folic acid/Folate) – Red blood cells | 200[125] | 600[125] | ng/mL or μg/L | |||
| 450[127] | 1400[127] | nmol/L | ||||
| Pregnant | 400[125] | ng/mL or μg/L | ||||
| 900[125] | nmol/L | |||||
| Vitamin B12 (Cobalamin) | 130,[128] 160[129] | 700,[128] 950[129] | ng/L | |||
| 100,[130] 120[4] | 520,[130] 700[4] | pmol/L | ||||
| Homocysteine | 3.3,[131] 5.9[131] | 7.2,[131] 15.3[131] | 6.3[59] | μmol/L | ||
| 45,[132] 80[132] | 100,[132] 210[132] | 85[59] | μg/dL | |||
| Vitamin C (Ascorbic acid) | 0.4[18] | 1.5[18] | 0.9[59] | mg/dL | ||
| 23[133] | 85[133] | 50[59] | μmol/L | |||
| 25-hydroxycholecalciferol (a vitamin D) | 8,[18][114] 9[114] | 40,[114] 80[18] | 30,[117] 40[118] | 65,[118] 100[117] | ng/mL | |
| 20,[115] 23[116] | 95,[116] 150[115] | 85,[59] 100[118] | 120,[59] 160[118] | nmol/L | ||
| Vitamin E | 28[59] | μmol/L | ||||
| 1.2[59] | mg/dL | |||||
Toxins
| Test | Limit type | Limit | Unit |
|---|---|---|---|
| Lead | Optimal health range | < 20[13] or 40[18] | µg/dL |
| Blood ethanol content | Limit for drunk driving | 0,[134] 0.2,[134] 0.8[134] | ‰ or g/L |
| 17.4[135] | mmol/L |
Hematology
Red blood cells
These values (except Hemoglobin in plasma) are for total blood and not only blood plasma.
| Test | Patient | Lower limit | Upper limit | Unit | Comments |
|---|---|---|---|---|---|
| Hemoglobin (Hb) | male | 2.0,[136] 2.1[9][137] | 2.5,[136] 2.7[9][137] | mmol/L | Higher in neonates, lower in children. |
| 130,[4] 132,[10] 135[9] | 162,[10] 170,[4] 175[9] | g/L | |||
| female | 1.8,[136] 1.9[9][137] | 2.3,[136] 2.5[9][136][137] | mmol/L | Sex difference negligible until adulthood. | |
| 120[4][9][10] | 150,[4] 152,[10] 160[9][18] | g/L | |||
| Hemoglobin subunits (sometimes displayed simply as "Hemoglobin") | male | 8.0,[138] 8.4[138] | 10.0,[138] 10.8[138] | mmol/L | 4 per hemoglobin molecule |
| female | 7.2,[138] 7.6[138] | 9.2,[138] 10.0[138] | |||
| Hemoglobin in plasma | 0.16[9] | 0.62[9] | μmol/L | Normally diminutive compared with inside red blood cells | |
| 1 | 4 | mg/dL | |||
| Glycated hemoglobin (HbA1c) | < 50 years | 3.6[4] | 5.0[4] | % of Hb | |
| > 50 years | 3.9[4] | 5.3[4] | |||
| Haptoglobin | < 50 years | 0.35[4] | 1.9[4] | g/L | |
| > 50 years | 0.47[4] | 2.1[4] | |||
| Hematocrit (Hct) | Male | 0.39,[4] 0.4,[10] 0.41,[9] 0.45[18] | 0.50,[4] 0.52,[10] 0.53,[9] 0.62[18] | ||
| Female | 0.35,[4] 0.36,[9] 0.37[10][18] | 0.46,[4][9][10] 0.48[18] | |||
| Child | 0.31[10] | 0.43[10] | |||
| Mean cell volume (MCV) | Male | 76,[18] 82[10] | 100,[18] 102[10] | fL | Cells are larger in neonates, though smaller in other children. |
| Female | 78[10] | 101[10] | fL | ||
| Red blood cell distribution width (RDW) | 11.5[10] | 14.5[10] | % | ||
| Mean cell hemoglobin (MCH) | 0.39[9] | 0.54[9] | fmol/cell | ||
| 25,[9] 27[4][18] | 32,[18] 33,[4] 35[9] | pg/cell | |||
| Mean corpuscular hemoglobin concentration (MCHC) | 31,[10] 32[4][18] | 35,[10] 36[4][18] | g/dL or %[note 1] | ||
| 4.8,[139] 5.0[139] | 5.4,[139] 5.6[139] | mmol/L | |||
| Erythrocytes/Red blood cells (RBC) | male | 4.2,[18] 4.3[4][9][10] | 5.7,[4] 5.9,[9] 6.2,[10] 6.9[18] | x1012/L or mln/mm3 | |
| Female | 3.5,[9] 3.8,[10] 3.9[4] | 5.1,[4] 5.5[9][10] | |||
| Infant/Child | 3.8[10] | 5.5[10] | |||
| Reticulocytes | Adult | 26[4] | 130[4] | x109/L | |
| Adult | 0.5[9][10] | 1.5[9][10] | % of RBC | ||
| Newborn | 1.1[10] | 4.5[10] | % of RBC | ||
| Infant | 0.5[10] | 3.1[10] | % of RBC | ||
White blood cells
These values are for total blood and not only blood plasma.
| Test | Patient type | Lower limit | Upper limit | Unit |
|---|---|---|---|---|
| White Blood Cell Count (WBC) | Adult | 3.5,[4] 3.9,[140] 4.1,[10] 4.5[9] | 9.0,[4] 10.0,[140] 10.9,[10] 11[9] |
|
| Newborn | 9[141] | 30[141] | ||
| 1 year old | 6[141] | 18[141] | ||
| Neutrophil granulocytes (A.K.A. grans, polys, PMNs, or segs) | Adult | 1.3,[4] 1.8,[140] 2[141] | 5.4,[4] 7,[140] 8[141] | x109/L |
| 45-54[9] | 62,[9] 74 | % of WBC | ||
| Newborn | 6[141] | 26[141] | x109/L | |
| Neutrophilic band forms | Adult | 0.7[141] | x109/L | |
| 3[9] | 5[9] | % of WBC | ||
| Lymphocytes | Adult | 0.7,[4] 1.0[140][141] | 3.5,[140] 3.9,[4] 4.8[141] | x109/L |
| 16-25[9] | 33,[9] 45 | % of WBC | ||
| Newborn | 2[141] | 11[141] | x109/L | |
| Monocytes | Adult | 0.1,[4] 0.2[142][143] | 0.8[4][141][143] | x109/L |
| 3,[9] 4.0 | 7,[9] 10 | % of WBC | ||
| Newborn | 0.4[141] | 3.1[141] | x109/L | |
| Mononuclear leukocytes (Lymphocytes + monocytes) | Adult | 1.5 | 5 | x109/L |
| 20 | 35 | % of WBC | ||
| CD4+ T cells | Adult | 0.4,[10] 0.5[13] | 1.5,[13] 1.8[10] | x109/L |
| Eosinophil granulocytes | Adult | 0.0,[4] 0.04[143] | 0.44,[143] 0.45,[141] 0.5[4] | x109/L |
| 1[9] | 3,[9] 7 | % of WBC | ||
| Newborn | 0.02[141] | 0.85[141] | x109/L | |
| Basophil granulocytes | Adult | 40[140] | 100,[4][143] 200,[141] 900[140] | x106/L |
| 0.0 | 0.75,[9] 2 | % of WBC | ||
| Newborn | 0.64[141] | x109/L |
Coagulation
| Test | Lower limit | Upper limit | Unit | Comments |
|---|---|---|---|---|
| Thrombocyte/Platelet count (Plt) | 140,[10] 150[4][9] | 350,[4][18] 400,[9] 450[10] | x109/L or x1000/µL | |
| Mean platelet volume (MPV) | 7.2,[144] 7.4,[145] 7.5[146] | 10.4,[145] 11.5,[146] 11.7[144] | fL | |
| Prothrombin time (PT) | 10,[13] 11,[9][147] 12[10] | 13,[13] 13.5,[147] 14,[10] 15[9] | s | PT reference varies between laboratory kits – INR is standardised |
| INR | 0.9[4] | 1.2[4] | The INR is a corrected ratio of a patient's PT to normal | |
| Activated partial thromboplastin time (APTT) | 18,[10] 30[4][13] | 28,[10] 42,[4] 45[13] | s | |
| Thrombin clotting time (TCT) | 11 | 18 | s | |
| Fibrinogen | 1.7,[10] 2.0[4] | 3.6,[4] 4.2[10] | g/L | |
| Antithrombin | 0.80[4] | 1.2[4] | kIU/L | |
| 0.15,[148] 0.17[149] | 0.2,[148] 0.39[149] | mg/mL | ||
| Bleeding time | 2 | 9 | minutes | |
| Viscosity | 1.5[150] | 1.72[150] | cP |
Immunology
Acute phase proteins
Acute phase proteins are markers of inflammation.
| Test | Patient | Lower limit | Upper limit | Unit | Comments |
|---|---|---|---|---|---|
| Erythrocyte sedimentation rate (ESR) | Male | 0 | Age÷2[151] | mm/h | ESR increases with age and tends to be higher in females.[152] |
| Female | (Age+10)÷2[151] | ||||
| C-reactive protein (CRP) | 5,[4][153] 6[154] | mg/L | |||
| 200,[155] 240[155] | nmol/L | ||||
| Alpha 1-antitrypsin (AAT) | 20,[156] 22[157] | 38,[157] 53[156] | μmol/L | ||
| 89,[158] 97[4] | 170,[4] 230[158] | mg/dL | |||
| Procalcitonin | 0.15[159] | ng/mL or μg/L |
Isotypes of antibodies
| Test | Patient | Lower limit | Upper limit | Unit |
|---|---|---|---|---|
| IgA | Adult | 70,[4] 110[160] | 360,[4] 560[160] | mg/dL |
| IgD | 0.5[160] | 3.0[160] | ||
| IgE | 0.01[160] | 0.04[160] | ||
| IgG | 800[160] | 1800[160] | ||
| IgM | 54[160] | 220[160] | ||
Autoantibodies
Autoantibodies are usually absent or very low, so instead of being given in standard reference ranges, the values usually denote where they are said to be present, or whether the test is a positive test. There may also be an equivocal interval, where it is uncertain whether there is a significantly increased level. All included values[161] are given for the ELISA test.
| Test | Negative | Equivocal | Positive | Unit |
|---|---|---|---|---|
| anti-SS-A (Ro) | < 15[162] | 15-25[162] | > 25[162] | Units per millilitre (U/mL) |
| anti-SS-B (La) | < 3[162] | 3–4[162] | > 4[162] | |
| Anti ds-DNA | < 40[162] | 40–60[162] | > 60[162] | |
| Anti ss-DNA | < 8[162] | 8–10[162] | > 10[162] | |
| Anti-histone antibodies | < 25[162] | n/a[162] | > 25[162] | |
| Cytoplasmic/classical anti-neutrophil cytoplasmic antibodies (c-ANCA) | < 20[162] | 21–30[162] | > 30[162] | |
| Perinuclear anti-neutrophil cytoplasmic antibodies (p-ANCA) | < 5[162] | n/a | > 5[162] | |
| Anti-mitochondrial antibodies (AMA) | < 10[162] | n/a[162] | > 10[162] | |
| Rheumatoid factor (RF) | < 20 | 20–30 | > 30[10] | |
| Antistreptolysin O titre (ASOT) in preschoolers | > 100 | |||
| ASOT at school age | > 250[10] | |||
| ASOT in adults | > 125[10] |
| Test | Negative | Low/weak positive | Moderate positive | High/strong positive | Unit |
|---|---|---|---|---|---|
| Anti-phospholipid IgG | < 20[162] | 20–30[162] | 31–50[162] | > 51[162] | GPLU/ml[162] |
| Anti-phospholipid IgM | < 1.5[162] | 1.5–2.5[162] | 2–9.9[162] | > 10[162] | MPL /ml[162] |
| Anti-phospholipid IgA | < 10[162] | 10–20[162] | 21–30[162] | > 31[162] | arb U/ml[162] |
| Anti-citrullinated protein antibodies | < 20[162] | 20–39[162] | 40–59[162] | > 60[162] | EU[162] |
Other immunology
| Test | Lower limit | Upper limit | Unit |
|---|---|---|---|
| Serum free light chains (FLC): kappa/lambda ratio | 0.26[163] | 1.65[163] | (unitless) |
Other enzymes and proteins
| Test | Lower limit | Upper limit | Unit | Comments |
|---|---|---|---|---|
| Serum total protein | 60,[9] 63[10] | 78,[9] 82,[10] 84[18] | g/L | |
| Lactate dehydrogenase (LDH) | 50[18] | 150[18] | U/L | |
| 0.4[49] | 1.7[49] | μmol/L | ||
| 1.8[4] | 3.4[4] | µkat/L | < 70 years old[4] | |
| Amylase | 25,[9] 30,[10] 53[18] | 110,[10] 120,[164] 123,[18] 125,[9] 190[49] | U/L | |
| 0.15[4] | 1.1[4] | µkat/L | ||
| 200[155] | 240[155] | nmol/L | ||
| D-dimer | n/a | 500[165] | ng/mL | Higher in pregnant women[166] |
| 0.5[4] | mg/L | |||
| Lipase | 7,[10] 10,[18] 23[49] | 60,[10] 150,[18] 208[49] | U/L | |
| Angiotensin-converting enzyme (ACE) | 23[49] | 57[49] | U/L | |
| Acid phosphatase | 3.0[49] | ng/mL | ||
| Eosinophil cationic protein (ECP) | 2.3[4] | 16[4] | µg/L |
Other electrolytes and metabolites
Electrolytes and metabolites: For iron and copper, some related proteins are also included.
| Test | Patient type | Lower limit | Upper limit | Unit | Comments |
|---|---|---|---|---|---|
| Osmolality | 275,[9] 280,[18] 281[4] | 295,[9] 296,[18] 297[4] | mOsm/kg | Plasma weight excludes solutes | |
| Osmolarity | Slightly less than osmolality | mOsm/L | Plasma volume includes solutes | ||
| Urea | 3.0[167] | 7.0[167] | mmol/L | BUN – blood urea nitrogen | |
| 7[9] | 18,[9] 21[10] | mg/dL | |||
| * Uric acid[10] | 0.18[9] | 0.48[9] | mmol/L | ||
| Female | 2.0[18] | 7.0[18] | mg/dL | ||
| Male | 2.1[18] | 8.5[18] | mg/dL | ||
| Creatinine | Male | 60,[4] 68[168] | 90,[4] 118[168] | μmol/L | May be complemented with creatinine clearance |
| 0.7,[169] 0.8[169] | 1.0,[169] 1.3[169] | mg/dL | |||
| Female | 50,[4] 68[168] | 90,[4] 98[168] | μmol/L | ||
| 0.6,[169] 0.8[169] | 1.0,[169] 1.1[169] | mg/dL | |||
| BUN/Creatinine Ratio | 5[18] | 35[18] | – | ||
| Plasma glucose (fasting) | 3.8,[9] 4.0[4] | 6.0,[4] 6.1[170] | mmol/L | See also glycated hemoglobin (in hematology) | |
| 65,[10] 70,[9] 72[171] | 100,[170] 110[18] | mg/dL | |||
| Full blood glucose (fasting) | 3.3[4] | 5.6[4] | mmol/L | ||
| 60[171] | 100[171] | mg/dL | |||
| Random glucose | 3.9[172] | 7.8[172] | mmol/L | ||
| 70[173] | 140[173] | mg/dL | |||
| Lactate (Venous) | 4.5[18] | 19.8[18] | mg/dL | ||
| 0.5[174] | 2.2[174] | mmol/L | |||
| Lactate (Arterial) | 4.5[18] | 14.4[18] | mg/dL | ||
| 0.5[174] | 1.6[174] | mmol/L | |||
| Pyruvate | 300[18] | 900[18] | μg/dL | ||
| 34[175] | 102[175] | μmol/L | |||
| Ketones | 1[176] | mg/dL | |||
| 0.1[176] | mmol/L | ||||
Medication
| Test | Lower limit | Upper limit | Unit | Comments |
|---|---|---|---|---|
| Digoxin | 0.5[177] | 2.0[177] | ng/mL | Narrow therapeutic window |
| 0.6[177] | 2.6[177] | nmol/L | ||
| Lithium | 0.4,[178] 0.5,[179][180] 0.8[181] | 1.3[179][180] | mmol/L | Narrow therapeutic window |
| Paracetamol | 30[182] | mg/L | Risk of paracetamol toxicity at higher levels | |
| 200[182] | µmol/L |
See also
Notes
- The MCHC in g/dL and the mass fraction of hemoglobin in red blood cells in % are numerically identical in practice, assuming a RBC density of 1g/mL and negligible hemoglobin in plasma.
References
- "Reference Ranges and What They Mean". Lab Tests Online (USA). Retrieved 22 June 2013.
- Page 19 in: Stephen K. Bangert MA MB BChir MSc MBA FRCPath; William J. Marshall MA MSc MBBS FRCP FRCPath FRCPEdin FIBiol; Marshall, William Leonard (2008). Clinical biochemistry: metabolic and clinical aspects. Philadelphia: Churchill Livingstone/Elsevier. ISBN 978-0-443-10186-1.CS1 maint: multiple names: authors list (link)
- Page 34: Units of measurement in Medical toxicology By Richard C. Dart Edition: 3, illustrated Published by Lippincott Williams & Wilkins, 2004 ISBN 0-7817-2845-2, ISBN 978-0-7817-2845-4 1914 pages
- Reference range list from Uppsala University Hospital ("Laborationslista"). Artnr 40284 Sj74a. Issued on April 22, 2008
- Arterial versus venous reference ranges - Brief Article Medical Laboratory Observer, April, 2000 by D. Robert Dufour
- Abbassi-Ghanavati, M.; Greer, L. G.; Cunningham, F. G. (2009). "Pregnancy and Laboratory Studies". Obstetrics & Gynecology. 114 (6): 1326–31. doi:10.1097/AOG.0b013e3181c2bde8. PMID 19935037.
- Armbruster, David; Miller (August 2007). "The Joint Committee for Traceability in Laboratory Medicine (JCTLM): A Global Approach to Promote the Standardisation of Clinical Laboratory Test Results". The Clinical Biochemist Reviews. 28 (3): 105–14. PMC 1994110. PMID 17909615.
- PROOPIOMELANOCORTIN; NCBI --> POMC Retrieved on September 28, 2009
- Last page of Deepak A. Rao; Le, Tao; Bhushan, Vikas (2007). First Aid for the USMLE Step 1 2008 (First Aid for the Usmle Step 1). McGraw-Hill Medical. ISBN 978-0-07-149868-5.
- Normal Reference Range Table Archived 2011-12-25 at the Wayback Machine from The University of Texas Southwestern Medical Center at Dallas. Used in Interactive Case Study Companion to Pathologic basis of disease.
- Derived from molar values using molar mass of 22.99 g•mol−1
- Derived from molar values using molar mass of 39.10 g•mol−1
- MERCK MANUALS > Common Medical Tests > Blood Tests Last full review/revision February 2003
- Derived from molar values using molar mass of 35.45 g•mol−1
- Larsson L, Ohman S (November 1978). "Serum ionized calcium and corrected total calcium in borderline hyperparathyroidism". Clin. Chem. 24 (11): 1962–65. PMID 709830.
- Derived from molar values using molar mass of 40.08 g•mol−1
- Derived from mass values using molar mass of 40.08 g•mol−1
- Blood Test Results – Normal Ranges Archived 2012-11-02 at the Wayback Machine Bloodbook.Com
- Slon S (2006-09-22). "Serum Iron". University of Illinois Medical Center. Archived from the original on 2006-10-28. Retrieved 2006-07-06.
- Diagnostic Chemicals Limited > Serum Iron-SL Assay Archived 2009-01-06 at the Wayback Machine July 15, 2005
- Derived from mass values using molar mass of 55.85 g•mol−1
- Table 1. Page 133" Clinical Chemistry 45, No. 1, 1999 (stating 1.9–3.3 g/L)
- Derived by dividing mass values with molar mass
- Ferritin by: Mark Levin, MD, Hematologist and Oncologist, Newark, NJ. Review provided by VeriMed Healthcare Network
- Andrea Duchini. "Hemochromatosis Workup". Medscape. Retrieved 2016-07-14. Updated: Jan 02, 2016
- Derived from mass values using molar mass of 450,000 g•mol−1
- Mitchell ML, Filippone MD, Wozniak TF (August 2001). "Metastatic carcinomatous cirrhosis and hepatic hemosiderosis in a patient heterozygous for the H63D genotype". Arch. Pathol. Lab. Med. 125 (8): 1084–7. doi:10.1043/0003-9985(2001)125<1084:MCCAHH>2.0.CO;2 (inactive 2019-08-20). PMID 11473464.
- Diaz J, Tornel PL, Martinez P (July 1995). "Reference intervals for blood ammonia in healthy subjects, determined by microdiffusion". Clin. Chem. 41 (7): 1048. PMID 7600690.
- Derived from molar values using molar mass of 17.03 g/mol
- Derived from mass values using molar mass of 63.55 g•mol−1
- "Reference range for copper". GPnotebook.
- Derived from mass using molar mass of 151kDa
- Walter F. Boron (2005). Medical Physiology: A Cellular And Molecular Approaoch. Elsevier/Saunders. ISBN 978-1-4160-2328-9. Page 849
- "Archived copy" (PDF). Archived from the original (PDF) on 2010-03-07. Retrieved 2010-01-17.CS1 maint: archived copy as title (link)
- Derived from molar values using molar mass of 65.38 g/mol
- Derived from mass values using molar mass of 65.38 g/mol
- Derived from molar values using molar mass of 24.31 g/mol
- Derived from mass values using molar mass of 24.31 g/mol
- Middleton P, Kelly AM, Brown J, Robertson M (August 2006). "Agreements between arterial and central venous values for pH, bicarbonate, base excess, and lactate". Emerg Med J. 23 (8): 622–24. doi:10.1136/emj.2006.035915. PMC 2564165. PMID 16858095.
- The Medical Education Division of the Brookside Associates--> ABG (Arterial Blood Gas) Retrieved on Dec 6, 2009
- Derived from molar values using molar mass of 1.01 g•mol−1
- Derived from mmHg values using 0.133322 kPa/mmHg
- Derived from molar values using molar mass of 44.010 g/mol
- Derived from molar values using molar mass of 61 g/mol
- "Reference range (albumin)". GPnotebook.
- Derived from mass using molecular weight of 65kD
- Derived from mass values using molar mass of 585g/mol
- Derived from molar values using molar mass of 585g/mol
- Fachwörterbuch Kompakt Medizin E-D/D-E. Author: Fritz-Jürgen Nöhring. Edition 2. Publisher:Elsevier, Urban&FischerVerlag, 2004. ISBN 3-437-15120-7, ISBN 978-3-437-15120-0. Length: 1288 pages
- GPnotebook > reference range (AST) Retrieved on Dec 7, 2009
- "Gamma-GT". Leistungsverzeichnis. Medizinisch-Diagnostische Institute. Archived from the original on 25 April 2012. Retrieved 20 November 2011.
- "Creatine kinase". GPnotebook.
- Page 585 in: Lee, Mary Ann (2009). Basic Skills in Interpreting Laboratory Data. Amer Soc of Health System. ISBN 978-1-58528-180-0.
- Muscle Information and Courses from MediaLab, Inc. > Cardiac Biomarkers Retrieved on April 22, 2010
- Ashvarya Mangla. "Troponins". medscape. Retrieved 2017-07-24. Updated: Jan 14, 2015
- Brenden CK, Hollander JE, Guss D, et al. (May 2006). "Gray zone BNP levels in heart failure patients in the emergency department: results from the Rapid Emergency Department Heart Failure Outpatient Trial (REDHOT) multicenter study". American Heart Journal. 151 (5): 1006–11. doi:10.1016/j.ahj.2005.10.017. PMID 16644322.
- Strunk A, Bhalla V, Clopton P, et al. (January 2006). "Impact of the history of congestive heart failure on the utility of B-type natriuretic peptide in the emergency diagnosis of heart failure: results from the Breathing Not Properly Multinational Study". The American Journal of Medicine. 119 (1): 69.e1–11. doi:10.1016/j.amjmed.2005.04.029. PMID 16431187.
- Page 220 in: Lee, Mary Ann (2009). Basic Skills in Interpreting Laboratory Data. Amer Soc of Health System. ISBN 978-1-58528-180-0.
- Adëeva Nutritionals Canada > Optimal blood test values Archived 2009-05-29 at the Wayback Machine Retrieved on July 9, 2009
- Derived from values in mg/dl to mmol/l, by dividing by 89, according to faqs.org: What are mg/dl and mmol/l? How to convert? Glucose? Cholesterol? Last Update July 21, 2009. Retrieved on July 21, 2009
- Derived from values in mg/dl to mmol/l, using molar mass of 386.65 g/mol
- "Reference range (cholesterol)". GPnotebook.
- Royal College of Pathologists of Australasia; Cholesterol (HDL and LDL) – plasma or serum Last Updated: Monday, 6 August 2007
- Derived from values in mmol/l, using molar mass of 386.65 g/mol
- What Your Cholesterol Levels Mean. American Heart Association. Retrieved on September 12, 2009
- American Association for Clinical Chemistry; HDL Cholesterol
- GP Notebook > range (reference, ca-125) Retrieved on Jan 5, 2009
- ClinLab Navigator > Test Interpretations > CA-125 Retrieved on March 8, 2011
- Bjerner J, Høgetveit A, Wold Akselberg K, et al. (June 2008). "Reference intervals for carcinoembryonic antigen (CEA), CA125, MUC1, Alfa-foeto-protein (AFP), neuron-specific enolase (NSE) and CA19.9 from the NORIP study". Scandinavian Journal of Clinical and Laboratory Investigation. 68 (8): 703–13. doi:10.1080/00365510802126836. PMID 18609108.
- Carcinoembryonic Antigen(CEA) at MedicineNet
- Luboldt, Hans-Joachim; Schindler, Joachim F.; Rübben, Herbert (2007). "Age-Specific Reference Ranges for Prostate-Specific Antigen as a Marker for Prostate Cancer". EAU-EBU Update Series. 5 (1): 38–48. doi:10.1016/j.eeus.2006.10.003. ISSN 1871-2592.
- Basuyau JP, Mallet E, Leroy M, Brunelle P (October 2004). "Reference intervals for serum calcitonin in men, women, and children". Clinical Chemistry. 50 (10): 1828–30. doi:10.1373/clinchem.2003.026963. PMID 15388660.
- The TSH Reference Range Wars: What's "Normal?", Who is Wrong, Who is Right... By Mary Shomon, About.com. Updated: June 19, 2006. About.com Health's Disease and Condition
- 2006 Press releases: Thyroid Imbalance? Target Your Numbers Archived 2008-03-03 at the Wayback Machine Contacts: Bryan Campbell American] Association of Clinical Endocrinologists
- The TSH Reference Range Wars: What's "Normal?", Who is Wrong, Who is Right... By Mary Shomon, About.com. Updated: June 19, 2006
- Demers, Laurence M.; Carole A. Spencer (2002). "LMPG: Laboratory Support for the Diagnosis and Monitoring of Thyroid Disease". National Academy of Clinical Biochemistry (USA). Retrieved 2007-04-13. – see Section 2. Pre-analytic factors
- Free T4; Thyroxine, Free; T4, Free Archived 2010-12-22 at the Wayback Machine UNC Health Care System
- Derived from molar values using molar mass of 776.87 g/mol
- Derived from mass values using molar mass of 776.87 g/mol
- Table 4: Typical reference ranges for serum assays Archived 2011-07-01 at the Wayback Machine – Thyroid Disease Manager
- van der Watt G, Haarburger D, Berman P (July 2008). "Euthyroid patient with elevated serum free thyroxine". Clinical Chemistry. 54 (7): 1239–41. doi:10.1373/clinchem.2007.101428. PMID 18593963.
- Derived from mass values using molar mass of 650.98 g/mol
- Cioffi M, Gazzerro P, Vietri MT, et al. (2001). "Serum concentration of free T3, free T4 and TSH in healthy children". Journal of Pediatric Endocrinology & Metabolism. 14 (9): 1635–9. doi:10.1515/jpem.2001.14.9.1635. PMID 11795654. INIST:13391788.
- Häggström, Mikael (2014). "Reference ranges for estradiol, progesterone, luteinizing hormone and follicle-stimulating hormone during the menstrual cycle". WikiJournal of Medicine. 1 (1). doi:10.15347/wjm/2014.001.
- Life Extension Foundation > Blood Testing Protocols
- Andrology Australia: Your Health > Low Testosterone > Diagnosis
- Derived from mass values using molar mass of 288.42g/mol
- Derived from molar values using molar mass of 288.42g/mol
- MedlinePlus > Testosterone Update Date: 3/18/2008. Updated by: Elizabeth H. Holt, MD, PhD, Yale University. Review provided by VeriMed Healthcare Network. Also reviewed by David Zieve, MD, MHA, Medical Director
- Derived from mass values using molar mass of 330.46g/mol
- reference range (FSH) GPnotebook. Retrieved on September 27, 2009
- Values taken from day 1 after LH surge in: Stricker R, Eberhart R, Chevailler MC, Quinn FA, Bischof P, Stricker R (2006). "Establishment of detailed reference values for luteinizing hormone, follicle stimulating hormone, estradiol, and progesterone during different phases of the menstrual cycle on the Abbott ARCHITECT analyzer". Clinical Chemistry and Laboratory Medicine. 44 (7): 883–87. doi:10.1515/CCLM.2006.160. PMID 16776638.
- New York Hospital Queens > Services and Facilities > Patient Testing > Pathology > New York Hospital Queens Diagnostic Laboratories > Test Directory > Reference Ranges Retrieved on Nov 8, 2009
- Mayo Medical Laboratories > Test ID: LH, Luteinizing Hormone (LH), Serum Archived 2016-09-25 at the Wayback Machine, retrieved December 2012
- GPNotebook – reference range (oestradiol) Retrieved on September 27, 2009
- Derived from molar values using molar mass of 272.38g/mol
- Total amount multiplied by 0.022 according to 2.2% presented in: Wu CH, Motohashi T, Abdel-Rahman HA, Flickinger GL, Mikhail G (August 1976). "Free and protein-bound plasma estradiol-17 beta during the menstrual cycle". J. Clin. Endocrinol. Metab. 43 (2): 436–45. doi:10.1210/jcem-43-2-436. PMID 950372.
- Derived from mass values using molar mass of 314.46 g/mol
- Bhattacharya Sudhindra Mohan (July/August 2005) Mid-luteal phase plasma progesterone levels in spontaneous and clomiphene citrate induced conception cycles J Obstet Gynecol India Vol. 55, No. 4 : July/August 2005 Pg 350-352
- Dehydroepiandrosterone Sulfate (DHEA-S), Serum Archived 2018-03-14 at the Wayback Machine at Mayo Foundation For Medical Education And Research. Retrieved July 2012
- Unit Code 91215 Archived 2011-07-20 at the Wayback Machine at Mayo Clinic Medical Laboratories. Retrieved April 2011
- Antimullerian Hormone (AMH), Serum from Mayo Medical Laboratories. Retrieved April 2012.
- Derived from mass values using 140,000 g/mol, as given in:
- Hampl R, Šnajderová M, Mardešić T (2011). "Antimüllerian hormone (AMH) not only a marker for prediction of ovarian reserve" (PDF). Physiological Research. 60 (2): 217–23. PMID 21114374.
- Derived from mass values using molar mass of 4540g/mol. This molar mass was taken from: PROOPIOMELANOCORTIN; NCBI --> POMC Retrieved on September 28, 2009
- "Adrenocorticotropic Hormone:Normal". WebMD. 09-03-2006. Retrieved 2008-11-09. Check date values in:
|date=(help) - Derived from molar values using molar mass of 4540g/mol. This molar mass was taken from: PROOPIOMELANOCORTIN; NCBI --> POMC Retrieved on September 28, 2009
- Biochemistry Reference Ranges at Good Hope Hospital Retrieved on Nov 8, 2009
- Derived from molar values using molar mass of 362 g/mol
- Friedrich N, Alte D, Völzke H, et al. (June 2008). "Reference ranges of serum IGF-1 and IGFBP-3 levels in a general adult population: results of the Study of Health in Pomerania (SHIP)". Growth Hormone & IGF Research. 18 (3): 228–37. doi:10.1016/j.ghir.2007.09.005. PMID 17997337.
- Taken from the assay method giving the lowest and highest estimate, respectively, from Table 2 in: Beltran L, Fahie-Wilson MN, McKenna TJ, Kavanagh L, Smith TP (October 2008). "Serum total prolactin and monomeric prolactin reference intervals determined by precipitation with polyethylene glycol: evaluation and validation on common immunoassay platforms". Clinical Chemistry. 54 (10): 1673–81. doi:10.1373/clinchem.2008.105312. PMID 18719199.
- Derived from molar values using molar mass of 9.4 kDa
- Table 2 in: Aloia JF, Feuerman M, Yeh JK (2006). "Reference range for serum parathyroid hormone". Endocr Pract. 12 (2): 137–44. doi:10.4158/ep.12.2.137. PMC 1482827. PMID 16690460.
- Derived from mass values using molar mass of 9.4 kDa
- Derived from molar values using molar mass 400.6 g/mol
- Bender, David A. (2003). "Vitamin D". Nutritional biochemistry of the vitamins. Cambridge: Cambridge University Press. ISBN 978-0-521-80388-5. Retrieved December 10, 2008 through Google Book Search.
- Bischoff-Ferrari HA, Dietrich T, Orav EJ, et al. (September 2004). "Higher 25-hydroxyvitamin D concentrations are associated with better lower-extremity function in both active and inactive persons aged > or =60 y". The American Journal of Clinical Nutrition. 80 (3): 752–58. doi:10.1093/ajcn/80.3.752. PMID 15321818.
- Reusch J, Ackermann H, Badenhoop K (May 2009). "Cyclic changes of vitamin D and PTH are primarily regulated by solar radiation: 5-year analysis of a German (50 degrees N) population". Horm. Metab. Res. 41 (5): 402–07. doi:10.1055/s-0028-1128131. PMID 19241329.
- Vasquez A, Cannell J (July 2005). "Calcium and vitamin D in preventing fractures: data are not sufficient to show inefficacy". BMJ. 331 (7508): 108–09, author reply 109. doi:10.1136/bmj.331.7508.108-b. PMC 558659. PMID 16002891.
- Converted from values in mcU/mL by dividing with a factor of 11.2 mcU/mL per ng/(mL*hour), as given in:
- New Assays for Aldosterone, Renin and Parathyroid Hormone Archived 2011-10-27 at the Wayback Machine University of
- Pratt RE, Flynn JA, Hobart PM, Paul M, Dzau VJ (March 1988). "Different secretory pathways of renin from mouse cells transfected with the human renin gene". The Journal of Biological Chemistry. 263 (7): 3137–41. PMID 2893797.
- New Assays for Aldosterone, Renin and Parathyroid Hormone Archived 2011-10-27 at the Wayback Machine University of Washington, Department of Laboratory Medicine. Retrieved Mars 2011
- Converted from values in ng/(mL*hour) by multiplying with a factor of 11.2 mcU/mL per ng/(mL*hour), as given in:
- New Assays for Aldosterone, Renin and Parathyroid Hormone Archived 2011-10-27 at the Wayback Machine University of
- Converted from mass values using molar mass of 360.44 g/mol
- Tiu SC, Choi CH, Shek CC, et al. (January 2005). "The use of aldosterone-renin ratio as a diagnostic test for primary hyperaldosteronism and its test characteristics under different conditions of blood sampling". The Journal of Clinical Endocrinology and Metabolism. 90 (1): 72–78. CiteSeerX 10.1.1.117.5182. doi:10.1210/jc.2004-1149. PMID 15483077.
- Central Manchester University Hospitals --> Reference ranges Retrieved on July 9, 2009
- University of Kentucky Chandler Medical Center > Clinical Lab Reference Range Guide Retrieved on April 28, 2009
- Derived from mass values using molar mass of 441 mol−1
- GPnotebook > B12 Retrieved on April 28, 2009
- Derived form molar values using molar mass of 1355g/mol
- Derived from mass values using molar mass of 1355g/mol
- The Doctor's Doctor: Homocysteine
- Derived from molar values using molar massof 135 g/mol
- Derived from mass values using molar mass of 176 grams per mol
- For Driving under the influence by country, see Drunk driving law by country
- Derived from mass values using molar mass of 46g/mol
- Derived from mass values using 64,500 g/mol. This molar mass was taken from: Van Beekvelt MC, Colier WN, Wevers RA, Van Engelen BG (2001). "Performance of near-infrared spectroscopy in measuring local O2 consumption and blood flow in skeletal muscle". J Appl Physiol. 90 (2): 511–19. doi:10.1152/jappl.2001.90.2.511. PMID 11160049.
- Normal Lab Values Archived 2014-12-16 at the Wayback Machine at Marshall University Joan C. Edwards School of Medicine. Retrieved July 2013
- molar concentration as given for hemoglobin above, but multiplied by 4, according to: Lodemann P, Schorer G, Frey BM (February 2010). "Wrong molar hemoglobin reference values-a longstanding error that should be corrected". Annals of Hematology. 89 (2): 209. doi:10.1007/s00277-009-0791-x. PMID 19609525.
- Derived from mass concentration, using molar mass of 64,458 g/mol. This molar mass was taken from: Van Beekvelt MC, Colier WN, Wevers RA, Van Engelen BG (2001). "Performance of near-infrared spectroscopy in measuring local O2 consumption and blood flow in skeletal muscle". J Appl Physiol. 90 (2): 511–519. doi:10.1152/jappl.2001.90.2.511. PMID 11160049.. Subsequently, 1 g/dL = 0.1551 mmol/L
- lymphomation.org > Tests & Imaging > Labs > Complete Blood Count Retrieved on May 14, 2009
- Clinical Laboratory Medicine. By Kenneth D. McClatchey. Page 807.
- Determination of monocyte count by hematological analyzers, manual method and flow cytometry in polish population Central European Journal of Immunology 1-2/2006. (Centr Eur J Immunol 2006; 31 (1-2): 1-5) authors: Elżbieta Górska, Urszula Demkow, Roman Pińkowski, Barbara Jakubczak, Dorota Matuszewicz, Jolanta Gawęda, Wioletta Rzeszotarska, Maria Wąsik,
- gpnotebook.co.uk > blood constituents (reference range) Retrieved on May 14, 2009
- Demirin H, Ozhan H, Ucgun T, Celer A, Bulur S, Cil H, Gunes C, Yildirim HA (2011). "Normal range of mean platelet volume in healthy subjects: Insight from a large epidemiologic study". Thromb. Res. 128 (4): 358–60. doi:10.1016/j.thromres.2011.05.007. PMID 21620440.
- Normal Values: RBC, Hgb, Hct, Indices, RDW, Platelets, and MPV (Conventional Units) Archived 2011-07-27 at the Wayback Machine From labcareplus. Retrieved 4 nov, 2010
- Lozano M, Narváez J, Faúndez A, Mazzara R, Cid J, Jou JM, Marín JL, Ordinas A (1998). "[Platelet count and mean platelet volume in the Spanish population]". Med Clin (Barc) (in Spanish). 110 (20): 774–77. PMID 9666418.
- MedlinePlus Encyclopedia 003652
- Antithrombin III at eMedicine
- Antithrombin CO000300 in Coagulation Test Handbook at Massachusetts General Hospital. In turn citing:
- Elizabeth M. Van Cott, M.D., and Michael Laposata, M.D., Ph.D., "Coagulation." In: Jacobs DS et al, ed. The Laboratory Test Handbook, 5th Edition. Lexi-Comp, Cleveland, 2001; 327-358.
- Retrieved on November 20, 2009
- Miller A, Green M, Robinson D (January 1983). "Simple rule for calculating normal erythrocyte sedimentation rate". British Medical Journal. 286 (6361): 266. doi:10.1136/bmj.286.6361.266. PMC 1546487. PMID 6402065.
- Böttiger LE, Svedberg CA (1967). "Normal erythrocyte sedimentation rate and age". Br Med J. 2 (5544): 85–87. doi:10.1136/bmj.2.5544.85. PMC 1841240. PMID 6020854.
- "C-reactive protein". GPnotebook.
- 2730 Serum C-Reactive Protein values in Diabetics with Periodontal Disease Archived 2008-12-20 at the Wayback Machine A.R. Choudhury, and S. Rahman, Birdem, Diabetic Association of Bangladesh, Dhaka, Bangladesh. (the diabetics were not used to determine the reference ranges)
- Derived from mass using molar mass of 25,106 g/mol
- Sipahi T, Kara C, Tavil B, Inci A, Oksal A (March 2003). "Alpha-1 antitrypsin deficiency: an overlooked cause of late hemorrhagic disease of the newborn". Journal of Pediatric Hematology/Oncology. 25 (3): 274–75. doi:10.1097/00043426-200303000-00019. PMID 12621252.
- Derived from mass values using molar mass of 44324.5 g/mol
- Derived from molar values using molar mass of 44324.5 g/mol
- "Procalcitonin, Serum". Mayo Clinic. Retrieved 2015-03-01.
- The Society for American Clinical Laboratory Science > Chemistry Tests > Immunoglobulins Archived 2009-10-15 at the Wayback Machine Retrieved on Nov 26, 2009
- All values cited from Chronolab are given for ELISA
- chronolab.com > Autoantibodies associated with rheumatic diseases > Reference ranges Retrieved on April 29, 2010
- Rajkumar SV, Kyle RA, Therneau TM, et al. (August 2005). "Serum free light chain ratio is an independent risk factor for progression in monoclonal gammopathy of undetermined significance". Blood. 106 (3): 812–17. doi:10.1182/blood-2005-03-1038. PMC 1895159. PMID 15855274.
- "Reference range (amylase)". GPnotebook.
- Ageno W, Finazzi S, Steidl L, et al. (2002). "Plasma measurement of D-dimer levels for the early diagnosis of ischemic stroke subtypes". Archives of Internal Medicine. 162 (22): 2589–93. doi:10.1001/archinte.162.22.2589. PMID 12456231.
- Kline JA, Williams GW, Hernandez-Nino J (May 2005). "D-dimer concentrations in normal pregnancy: new diagnostic thresholds are needed". Clinical Chemistry. 51 (5): 825–29. doi:10.1373/clinchem.2004.044883. PMID 15764641.
- Gardner MD, Scott R (April 1980). "Age- and sex-related reference ranges for eight plasma constituents derived from randomly selected adults in a Scottish new town". Journal of Clinical Pathology. 33 (4): 380–85. doi:10.1136/jcp.33.4.380. PMC 1146084. PMID 7400337.
- Finney H, Newman DJ, Price CP (January 2000). "Adult reference ranges for serum cystatin C, creatinine and predicted creatinine clearance". Annals of Clinical Biochemistry. 37 (1): 49–59. doi:10.1258/0004563001901524. PMID 10672373.
- Derived from molar values by multiplying with the molar mass of 113.118 g/mol, and divided by 10.000 to adapt from μg/L to mg/dL
- MedlinePlus Encyclopedia Glucose tolerance test
- Derived from molar values using molar mass of 180g/mol
- Derived from mass values using molar mass of 180g/mol
- "Diabetes – Prevention". Cleveland Clinic. Retrieved 2016-06-23. Last revised 1/15/2013
- Derived from mass values using molar mass of 90.08 g/mol
- Derived from mass values using molar mass of 88.06 g/mol
- Ketones at eMedicine
- Page 700 in:
Richard C. Dart (2004). Medical Toxicology. Lippincott Williams & Wilkins=year=2004. ISBN 9780781728454. - The UK Electronic Medical Compendium recommends 0.4–0.8 mmol/l plasma lithium level in adults for prophylaxis of recurrent affective bipolar manic-depressive illness Camcolit 250 mg Lithium Carbonate Archived 2016-03-04 at the Wayback Machine Revision 2 December 2010, Retrieved 5 May 2011
- Amdisen A. (1978). "Clinical and serum level monitoring in lithium therapy and lithium intoxication". J. Anal. Toxicol. 2 (5): 193–202. doi:10.1093/jat/2.5.193.
- R. Baselt, Disposition of Toxic Drugs and Chemicals in Man, 8th edition, Biomedical Publications, Foster City, CA, 2008, pp. 851–54.
- One study (Solomon, D.; Ristow, W.; Keller, M.; Kane, J.; Gelenberg, A.; Rosenbaum, J.; Warshaw, M. (1996). "Serum lithium levels and psychosocial function in patients with bipolar I disorder". The American Journal of Psychiatry. 153 (10): 1301–07. doi:10.1176/ajp.153.10.1301. PMID 8831438.) concluded a "low" dose of 0.4–0.6 mmol/L serum lithium treatment for patients with bipolar 1 disorder had less side effects, but a higher rate of relapse, than a "standard" dose of 0.8–1.0 mmol/l. However, a reanalysis of the same experimental data (Perlis, R.; Sachs, G.; Lafer, B.; Otto, M.; Faraone, S.; Kane, J.; Rosenbaum, J. (2002). "Effect of abrupt change from standard to low serum levels of lithium: A reanalysis of double-blind lithium maintenance data". The American Journal of Psychiatry. 159 (7): 1155–59. doi:10.1176/appi.ajp.159.7.1155. PMID 12091193.) concluded the higher rate of relapse for the "low" dose was due to abrupt changes in the lithium serum levels
- John Marx; Ron Walls; Robert Hockberger (2013). Rosen's Emergency Medicine – Concepts and Clinical Practice. Elsevier Health Sciences. ISBN 9781455749874.
External links
Further reading
- Rappoport, n.; Paik, P.; Oskotsky, B.; Tor, R.; Ziv, E.; Zaitlen, N.; Butte, A. (4 November 2017). "Creating ethnicity-specific reference intervals for lab tests from EHR data". bioRxiv 213892.