

Motor Vehicle Injuries
 ShareCompartir
For the most part, the number and rate of motor vehicle crash deaths has fallen since 2005; however, the number of deaths in 2015 increased to 35,092 (the highest number since 2008). Continued implementation of proven strategies can save thousands of lives and hundreds of millions of dollars in direct medical costs from motor vehicle crash injuries and deaths each year.
- Motor vehicle crashes are the leading cause of death in the first three decades of Americans’ lives.
- Motor vehicle crashes killed over 35,000 people in 2015 — that’s about 96 people every day.
- Motor vehicle-related injuries send more than 2.3 million people to hospital emergency departments every year.
Progress in motor vehicle injuries
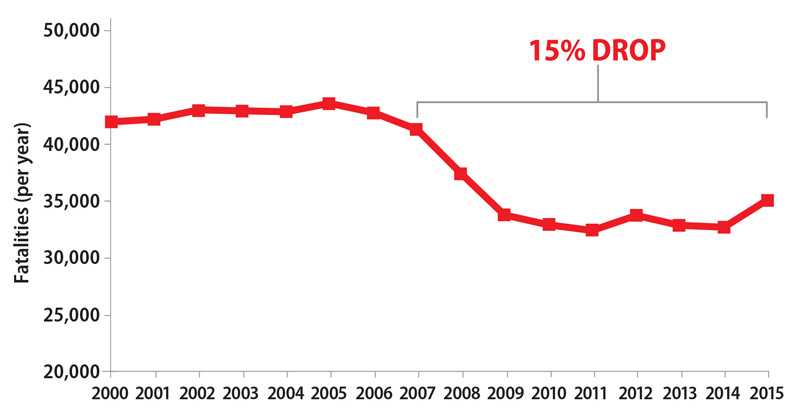
Motor vehicle-related deaths decreased between 2007 – 2015
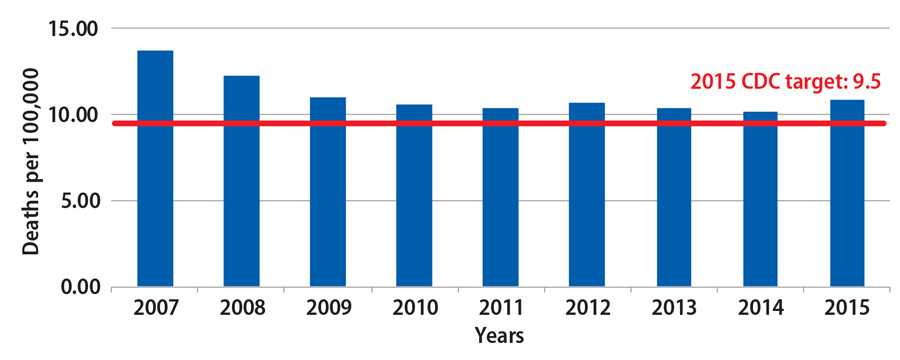
Trends in Motor Vehicle Injuries Winnable Battle Indicator
Trends in motor vehicle-related fatalities, 2007 – 2015
Source: National Highway Traffic Safety Administration (NHTSA). Fatality Analysis Reporting System (FARS) U.S. Census Bureau

Considerations in Choosing Motor Vehicle Injuries as Winnable Battle
- Motor vehicle crash deaths cost the nation $44 billion in medical expenses and work loss costs in a single year.
- The demonstrated effectiveness of primary seat belt laws created an opportunity for near-term success in lowering motor vehicle-related deaths.
- Other evidence-based strategies, such as ignition interlocks and graduated driver’s license (GDL) programs, created additional opportunities for improved motor vehicle safety.
Challenges / Obstacles
- Linking motor vehicle crash data from various sources (police, EMS, emergency departments, hospitals, medical examiners, and coroners) can be complex, but data linkage is necessary to share critical information about what happened before, during, and after a crash providing a complete picture that informs prevention efforts.
CDC Contributions in Motor Vehicle Injuries Winnable Battle
By focusing on a few key strategies that would have the most impact on the health of Americans, the Motor Vehicle Injury Winnable Battle articulated a clear set of evidence-based policies and practices to reduce motor vehicle injuries and deaths.
Prevent crash-related deaths by increasing restraint use and decreasing impaired driving
- CDC released an interactive calculator, called the MV PICCS (Motor Vehicle Prioritizing Interventions and Cost Calculator for States). This tool helps state decision makers prioritize and select from a suite of 14 effective motor vehicle injury prevention interventions. It is designed to calculate the expected number of injuries prevented and lives saved at the state level, as well as the costs of implementation, while taking into account the state’s available resources.
- Transportation Safety has been a feature of the CDC Vital Signs seven times since 2011. Recent issues include child-passenger safety and looking at fatalities in the context of other high-income countries.
- CDC released a July 2016 Vital Signs comparing motor vehicle crash death rates in the United States and 19 high-income comparison countries. Data compiled by the World Health Organization (WHO) and the Organization for Economic Co-operation and Development (OECD) were analyzed. CDC determined the number and rate of motor vehicle crash deaths (per 100,000 population, per 100 million VMT, and per 10,000 registered vehicles) in the U.S. and 19 other high-income countries and reported national seat belt use and percentage of deaths that involved alcohol-impaired driving or speeding, by country, when available. The United States has made progress in road safety, reducing crash death rates by 31 percent from 2000 to 2013. But other high-income countries reduced crash death rates even further — by an average of 56 percent during the same period.
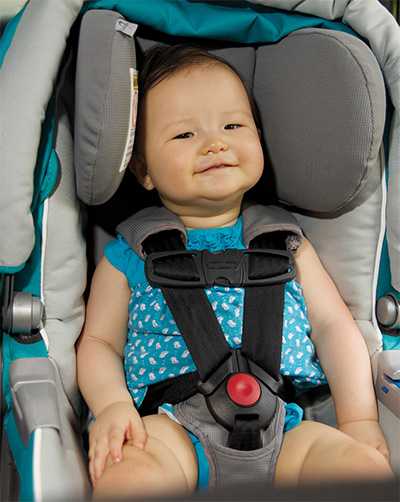
- CDC released a Vital Signs on child passenger safety in February 2014 which reported motor vehicle crash deaths among children age 12 and younger decreased by 43% from 2002 – 2011; however, still more than 9,000 children died in crashes during that period. Of children who died in a crash, one in three was not buckled up, and more black and Hispanic children were not buckled compared with white children.
- CDC’s State Specific Fact Sheets on Cost of Motor Vehicle Crash Deaths, Restraint Use, and Drunk Driving highlight data and proven strategies for reducing injury and saving lives. States and their partners can download fact sheets with state-specific data and information that can help in implementing strategies to save lives.
- To support efforts to keep impaired drivers off the road, CDC released “Increasing Alcohol Ignition Interlock Use: Successful Practices for States” and in partnership with NHTSA released the “Evaluation of the State Ignition Interlock Programs.”
- Prevention Status Reports (PSRs) are state-level reports that highlight the status of policies and practices in states designed to address 10 important health problems, one of them being motor vehicle injury. It includes new details and recommended components of the graduated driver licensing indicator. Research indicates that more comprehensive GDL systems prevent more crashes and save more lives than less comprehensive GDL systems. Other indicators cover the use of seat belts, car seats and booster seats, and ignition interlock devices.
- To raise awareness and promote prevention of teen driving related injuries and deaths, CDC re-launchedParents Are the Key, a campaign that provides information and tools for parents, pediatricians, and communities around safe teen driving. Motor vehicle crashes are the leading cause of death among teens. Over 100,000 people have accessed the website and 40,000 materials have been downloaded.
Improve motor vehicle safety in occupational settings
- Motor vehicle crashes are the leading cause of work-related fatalities in the United States, accounting for over 22,000 deaths between 2003 and 2014. The number and rate of deaths declined in 2008 and 2009, in line with the decline in traffic deaths in the general population. Since 2009, however, both indicators have begun to increase again, although not to pre-2008 levels.
- Employer and worker information on motor vehicle safety was prepared and broadly disseminated including: to truckers on the importance of wearing a seatbelt and obtaining quality sleep to prevent drowsy driving; to employers on steps they can take to develop effective motor vehicle safety programs; and to workers and employers on safe driving at work by older workers.
- Based on CDC work, a national consensus standard used by employers to develop safe workplace driving programs includes stronger language on employer policies on seat belt use, fatigue management, and speed control.
- The NIOSH National Survey of Long-haul Truck Driver Health and Injury found that: 35% of drivers had experienced a crash during their career; 6% never wore a seat belt while driving a truck; sometimes or often, 37% did not follow hours-of-service rules that limit driving time; 73% perceived delivery schedules as too tight, at least some of the time; and 38% reported having received inadequate entry-level training.
- Linked worker fatality data from the Departments of Labor (DOL) and Transportation (DOT) support a view of work-related crashes as a broad, multi-faceted risk that is not limited to truck drivers and other “professional” drivers. The DOT data, based on police crash reports, were considerably less likely to identify certain types of fatalities as work-related: workers employed outside transportation industries and occupations, and those who were driving in or riding in lighter vehicles.
Tribal Spotlight: The Hopi Tribe
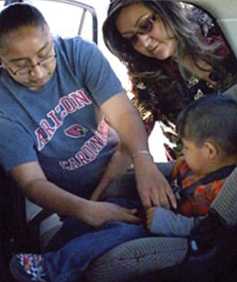
Unintentional injury was a leading cause of death in Arizona for American Indians/Alaska Natives, all ages, from 1999-2009 with motor vehicle related injuries the leading specific injury type.1 On the Hopi Reservation, motor vehicle-related injury was the leading cause of injury death from 2004-2008,2 and occupant restraint use on Hopi Reservation was historically very low.3 To combat these issues, the Hopi Tribe used CDC funding to improve collaboration with law enforcement to strengthen their existing seat belt law. Also, a successful media campaign raised awareness among tribal members about the importance of buckling up. The campaign, educational efforts, and improved enforcement led to an increase of 36% (from 39% to 53%) in seat belt use, and increase of 32% (22% to 29%) in child safety seat use.
Improve motor vehicle safety, decrease crashes and reduce motor vehicle related fatalities among tribal populations
- Motor vehicle crashes are a leading cause of unintentional injury for American Indians/Alaska Natives (AI/AN) ages 1 to 44 and AI / AN adults are 1.5 times more likely to die in a crash than whites or blacks. In September 2015, CDC in partnership with the Indian Health Service (IHS) developed the Roadway to Safer Tribal Communities Toolkit to provide materials including fact sheets, posters and a video to help prevent crash-related injuries and deaths among members of tribal nations.
- In late 2016, CDC will disseminate the Tribal Motor Vehicle Injury Prevention (TMVIP) Best Practices Guide, in collaboration with Federal partners, which will share the results of the 2010 – 2014 Tribal Motor Vehicle Injury Prevention Program.
- CDC’s tribal motor vehicle safety program (Tribal Motor Vehicle Injury Prevention Program) decreased crashes, increased restraint use, and decreased alcohol-impaired driving through direct funding of 12 tribes. CDC built on this success and expanded its reach to a greater number of tribes by partnering with the Federal Highway Administration. This partnership allows CDC to reach up to 37% of the 567 federally recognized tribes in the United States to reduce motor vehicle-related fatalities and injuries in Indian Country through technical support, training, and other activities.
Deepen understanding of motor vehicle crashes through improved data linkages to improve prevention efforts
- CDC and NHTSA conducted a joint evaluation to increase knowledge about 25 state data linkage systems, including NHTSA’s Crash Outcome Data Evaluation System (CODES).
- CDC is beginning work on a state data linkage implementation manual. High quality, reliable linked data are needed to
- show the total impact of crash injuries (e.g., medical and costs)
- support states in identifying crash risk factors (e.g., restraint use)
- design and implement effective strategies
- evaluate implemented strategies
1 Centers for Disease Control and Prevention/Web-based Injury Statistics Query and Reporting System.
2 A. Shacter, unpublished data.
3 IHS/OEHE, unpublished data.
- Page last reviewed: November 9, 2016
- Page last updated: November 9, 2016
- Content source: