

State-Specific Costs of Motor Vehicle Crash Deaths
 ShareCompartir
Over 30,000 people are killed in motor vehicle crashes each year in the United States. In 2013, crash deaths resulted in $44 billion in medical and work loss costs in addition to the immeasurable burden on the victims’ families and friends.
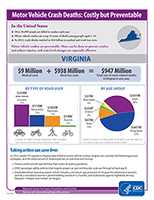
The fact sheets below highlight the cost of deaths from motor vehicle crashes and show which age groups and types of road users account for the largest portion of these costs in each state. Within these fact sheets the CDC also makes recommendations of proven strategies that could strengthen each state’s motor vehicle injury prevention efforts, and save both lives and money. For example, rates of seat belt use are 9 percentage points higher in primary enforcement states compared to secondary enforcement states.1 Such an increase is important since seat belt use reduces the risk of death by about half.2 Many evidence-based strategies, including the primary enforcement of seat belt laws for all seating positions, can significantly reduce the number of injuries and deaths from motor vehicle crashes and the related costs.
Take a look at the fact sheets below to find strategies specific to each state.
 Download
Note: The state-specific fact sheets contain 2013 data.
1. Where did CDC obtain the data used for this analysis?
The data used for this cost analysis came from CDC’s Web-based Injury Statistics Query and Reporting System (WISQARS), which is an online, interactive system that provides reports of injury-related data. To find the costs of various injury deaths and nonfatal injuries, visit CDC’s WISQARS.
2. What are work loss costs?
Work loss costs are estimates of how much a person who died in a motor vehicle crash would have earned over the course of their life, had they not died. Work loss costs include the total estimated salary, various benefits, and value of household work that an average person of the same age and sex would be expected to produce over the remainder of his or her lifetime.
3. Did this analysis look at the cost of fatal crashes in each state, or just deaths from crashes?
Our analysis only looked at the cost of medical care and work loss for people who died in motor vehicle crashes. We did not look at total costs of fatal crashes, which could involve medical care for people who survived a crash in which someone else was killed. We also did not look at property damage and vehicle damage costs or the cost related to insurance.
4. Why are work loss costs so high for motor vehicle crash deaths?
Work loss costs are based on estimates of how much a person who died in a crash would have earned over the course of their life, had they not died. Motor vehicle crash deaths disproportionately affect younger people, who have the potential to contribute to the workforce for many years. Therefore, when a younger person dies, the result is a higher work loss cost.
5. How can costs due to motor vehicle crashes be reduced?
The best way to reduce costs due to crash-related deaths is to prevent crashes. Effective strategies for preventing crashes include graduated drivers licensing laws, sobriety checkpoints, and ignition interlocks for those convicted of driving while intoxicated.
Another way to reduce costs is to prevent injuries when crashes happen. Proven ways to prevent injuries during a crash include increasing car seat and booster seat use, and increasing seat belt use through primary seat belt laws that cover all seating positions. Riding in vehicles with advanced safety features like occupant-sensitive/dual-stage airbags, electronic stability control, rollover protection, and automatic crash notification can also help mitigate injuries and improve emergency response.
6. Why did CDC choose to only look at state-based costs related to deaths and not non-fatal crash injuries?
Non-fatal crash costs are not available on a state-by-state basis. However, successful state data linkage systems collect, link, analyze, and report on multiple sources of motor vehicle crash data. Linking police crash reports to medical records can be used to determine state medical costs for non-fatal crash injuries. To learn more about successful state motor vehicle data linkage systems, visit Assessment of Characteristics of State Data Linkage Systems.
7. Isn’t it expected that larger states with larger populations would naturally have higher costs?
States with larger populations often have more people on the roadways, and therefore more crashes may occur. However, just because a state has a large or small population does not mean that its costs should be proportional. Wyoming, for example, has the smallest population of all the states, but does not have the lowest cost. More than half of the United States population lives in the states with the 10 highest costs.
8. What does the other/unspecified category mean?
The cost figures presented in the fact sheets are based on information collected by each individual state. As a result, there are differences between states in the way they collect and categorize these data. “Other/unspecified” indicates that the state either did not classify the type of road user who was killed in a crash, or that the person killed was the rider of a train, streetcar, animal, or animal-drawn vehicle, such as a horse carriage.
References
- Beck LF, West BA. Vital Signs: Motor Vehicle Occupant Nonfatal Injuries (2009) and Seat Belt Use (2008) Among Adults—United States. Centers for Disease Control and Prevention. 2011.
- Dept of Transportation (US), National Highway Traffic Safety Administration (NHTSA). Traffic Safety Facts: Children. Washington (DC): NHTSA; 2010. Available at URL: http://www-nrd.nhtsa.dot.gov/Pubs/811387.pdf

- Page last reviewed: December 14, 2015
- Page last updated: December 14, 2015
- Content source:
- Centers for Disease Control and Prevention,
- National Center for Injury Prevention and Control,
- Division of Unintentional Injury Prevention