

Impaired Driving: Get the Facts
 ShareCompartir
Every day, 28 people in the United States die in motor vehicle crashes that involve an alcohol-impaired driver. This is one death every 51 minutes.1 The annual cost of alcohol-related crashes totals more than $44 billion.2
Thankfully, there are effective measures that can help prevent injuries and deaths from alcohol-impaired driving.
How big is the problem?
- In 2015, 10,265 people died in alcohol-impaired driving crashes, accounting for nearly one-third (29%) of all traffic-related deaths in the United States.1
- Of the 1, 1,132 traffic deaths among children ages 0 to 14 years in 2015, 209 (16%) involved an alcohol-impaired driver.1
- In 2015, nearly 1.1 million drivers were arrested for driving under the influence of alcohol or narcotics.3 That’s one percent of the 111 million self-reported episodes of alcohol-impaired driving among U.S. adults each year.4
- Drugs other than alcohol (legal and illegal) are involved in about 16% of motor vehicle crashes.5
- Marijuana use is increasing6 and 13% of nighttime, weekend drivers have marijuana in their system.7
- Marijuana users were about 25% more likely to be involved in a crash than drivers with no evidence of marijuana use, however other factors – such as age and gender – may account for the increased crash risk among marijuana users.5
Annual Self-reported Alcohol-impaired Driving Episodes among U.S. Adults, 1993–2014
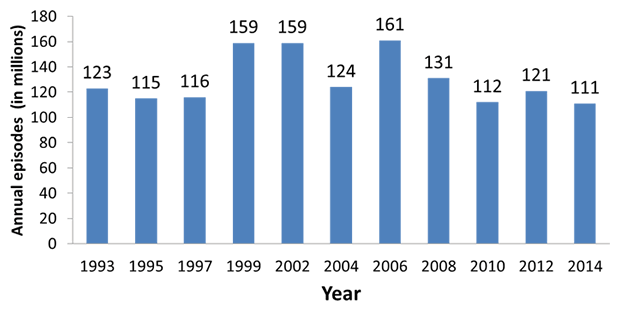
Source: CDC. Behavioral Risk Factor Surveillance System (BRFSS), 1993–2014. Available at https://www.cdc.gov/brfss
Note: The annual estimated alcohol-impaired driving episodes were calculated using BRFSS respondents’ answers to this question: “During the past 30 days, how many times have you driven when you’ve had perhaps too much to drink?” Annual estimates per respondent were calculated by multiplying the reported episodes during the preceding 30 days by 12. These numbers were summed to obtain the annual national estimates (see https://www.cdc.gov/mmwr/preview/mmwrhtml/mm6430a2.htm).
Who is most at risk?
Young people:
- At all levels of blood alcohol concentration (BAC), the risk of being involved in a crash is greater for young people than for older people.8
- Among drivers with BAC levels of 0.08% or higher involved in fatal crashes in 2015, nearly three in 10 were between 21 and 24 years of age (28%). The next two largest groups were ages 25 to 34 (27%) and 35 to 44 (23%).1
Motorcyclists:
- Among motorcyclists killed in fatal crashes in 2015, 27% had BACs of 0.08% or greater.1
- Motorcyclists ages 35-39 have the highest percentage of deaths with BACs of 0.08% or greater (37% in 2015).9
Drivers with prior driving while impaired (DWI) convictions:
- Drivers with a BAC of 0.08% or higher involved in fatal crashes were 4.5 times more likely to have a prior conviction for DWI than were drivers with no alcohol in their system. (9% and 2%, respectively).1
What are the effects of blood alcohol concentration (BAC)?
Information in this table shows the blood alcohol concentration (BAC) level at which the effect usually is first observed.
| Blood Alcohol Concentration (BAC)* | Typical Effects | Predictable Effects on Driving |
|---|---|---|
| .02% About 2 alcoholic drinks** |
|
|
| .05% About 3 alcoholic drinks** |
|
|
| .08% About 4 alcoholic drinks** |
|
|
| .10% About 5 alcoholic drinks** |
|
|
| .15% About 7 alcoholic drinks** |
|
|
*Blood Alcohol Concentration Measurement
The number of drinks listed represents the approximate amount of alcohol that a 160-pound man would need to drink in one hour to reach the listed BAC in each category.
**A Standard Drink Size in the United States
A standard drink is equal to 14.0 grams (0.6 ounces) of pure alcohol. Generally, this amount of pure alcohol is found in
- 12-ounces of beer (5% alcohol content)
- 8-ounces of malt liquor (7% alcohol content)
- 5-ounces of wine (12% alcohol content)
- 1.5-ounces or a “shot” of 80-proof (40% alcohol content) distilled spirits or liquor (e.g., gin, rum, vodka, whiskey)
Adapted from The ABCs of BAC, National Highway Traffic Safety Administration, 2005, and How to Control Your Drinking, WR Miller and RF Munoz, University of New Mexico, 1982.
How can deaths and injuries from impaired driving be prevented?
Effective measures include:
- Actively enforcing existing 0.08% BAC laws, minimum legal drinking age laws, and zero tolerance laws for drivers younger than 21 years old in all states.4,10
- Requiring ignition interlocks for all offenders, including first-time offenders 11
- Using sobriety checkpoints.12
- Putting health promotion efforts into practice that influence economic, organizational, policy, and school/community action.13,14
- Using community-based approaches to alcohol control and DWI prevention.10,14,15
- Requiring mandatory substance abuse assessment and treatment, if needed, for DWI offenders.16
- Raising the unit price of alcohol by increasing taxes.17
Areas for continued research:
- Reducing the illegal BAC threshold to 0.05%.18-22
- Mandatory blood alcohol testing when traffic crashes result in injury.23
- Does marijuana impair driving? How and at what level?
- Does marijuana use increase the risk of motor vehicle crashes?
What safety steps can individuals take?
Whenever your social plans involve alcohol and/or drugs, make plans so that you don’t have to drive while impaired. For example:
- Before drinking, designate a non-drinking driver when with a group.
- Don’t let your friends drive impaired.
- If you have been drinking or using drugs, get a ride home or call a taxi.
- If you’re hosting a party where alcohol will be served, remind your guests to plan ahead and designate their sober driver; offer alcohol-free beverages, and make sure all guests leave with a sober driver.
Related Pages
- Sobering Facts: Drunk Driving State Fact Sheets
- What Works: Strategies to Reduce or Prevent Drunk Driving
- Increasing Alcohol Ignition Interlock Use
- State-Based Motor Vehicle Data & Information
- CDC Vital Signs: Teen Drinking and Driving – A Dangerous Mix (October 2012)
- BRFSS AID Report: Alcohol-Impaired Driving Among Adults— United States, 2012 (August 2015)
Additional Data
- Drunk Driving State Data and Maps
-
Motor Vehicle Prioritizing Interventions and Cost Calculator for States (MV PICCS)
CDC offers an interactive calculator to help state decision makers prioritize and select from a suite of 14 effective motor vehicle injury prevention interventions. MV PICCS is designed to calculate the expected number of injuries prevented and lives saved at the state level and the costs of implementation, while taking into account available resources. -
data.cdc.gov
View and download dozens of motor vehicle datasets and visualizations, including charts and maps, on data.cdc.gov.
References
- Department of Transportation (US), National Highway Traffic Safety Administration (NHTSA). Traffic Safety Facts 2014 data: alcohol-impaired driving. Washington, DC: NHTSA; 2015 [cited 2016 Feb 5]. Available at URL: http://www-nrd.nhtsa.dot.gov/Pubs/812231.pdf.
- Blincoe LJ, Miller TR, Zaloshnja E, Lawrence BA. The economic and societal impact of motor vehicle crashes, 2010. (Revised). Washington, DC: NHTSA; 2015. [cited 2016 Feb 5]. Available at URL: http://www-nrd.nhtsa.dot.gov/pubs/812013.pdf.
- Department of Justice (US), Federal Bureau of Investigation (FBI). Crime in the United States 2015: Uniform Crime Reports. Washington (DC): FBI; 2016 [cited 2017 Jun 1]. Available at URL https://ucr.fbi.gov/crime-in-the-u.s/2015/crime-in-the-u.s.-2015/tables/table-29.
- Jewett A, Shults RA, Banerjee T, Bergen G Alcohol-impaired driving among adults— United States, 2012. MMWR Morb Mortal Wkly Rep. 2015;64(30):814-17. Available at URL: https://www.cdc.gov/mmwr/preview/mmwrhtml/mm6430a2.htm
- Compton RP, Berning A. Traffic Safety Facts Research Note: drugs and alcohol crash risk. Washington, DC: NHTSA; 2015 [cited 2016 Feb 5]. Available at URL: http://www.nhtsa.gov/staticfiles/nti/pdf/812117-Drug_and_Alcohol_Crash_Risk.pdf.
- Substance Abuse and Mental Health Administration. Cannabis. 2015 6/2/2015 [cited 2015 Jul 17]. Available at URL: http://www.samhsa.gov/atod/cannabis.
- Berning A, Compton R, Wochinger K. Results of the 2013–2014 National Roadside Survey of alcohol and drug use by drivers. Washington, DC: NHTSA; 2015 (DOT HS 812 118).
- Zador PL, Krawchuk SA, Voas RB. Alcohol-related relative risk of driver fatalities and driver involvement in fatal crashes in relation to driver age and gender: an update using 1996 data. Journal of Studies on Alcohol 2000;61:387-95.
- Department of Transportation (US), National Highway Traffic Safety Administration (NHTSA). Traffic Safety Facts 2015 data: motorcycles. Washington, DC: NHTSA; 2017 [cited 2017 Jun1]. Available at URL: http://www-nrd.nhtsa.dot.gov/Pubs/812353.pdf.
- Guide to Community Preventive Services. Motor vehicle-related injury prevention: reducing alcohol-impaired driving. [cited 2016 Feb 5]. Available at URL: http://www.thecommunityguide.org/mvoi/AID/index.html.
- Guide to Community Preventive Services. Reducing alcohol-impaired driving: ignition interlocks. [cited 2016 Feb 5]. Available at URL: http://www.thecommunityguide.org/mvoi/AID/ignitioninterlocks.html.
- Guide to Community Preventive Services. Reducing alcohol-impaired driving: publicized sobriety checkpoint programs. [cited 2016 Feb 5]. Available at URL: http://www.thecommunityguide.org/mvoi/AID/sobrietyckpts.html.
- Hingson R, Sleet DA. Modifying alcohol use to reduce motor vehicle injury. In Gielen AC, Sleet DA, DiClemente R (Eds). Injury and Violence Prevention: Behavior change Theories, Methods, and Applications. San Francisco, CA: Jossey-Bass, 2006.
- Holder HD, Gruenewald PJ, Ponicki WR, et al. Effect of community-based interventions on high-risk drinking and alcohol-related injuries. JAMA 2000;284:2341-7.
- Shults RA, Elder RW, Nichols J, et al. Effectiveness of multicomponent programs with community mobilization for reducing alcohol-impaired driving. Am J Prev Med 2009;37(4):360-371.
- Higgins-Biddle J, Dilonardo J. Alcohol and highway safety: screening and brief intervention for alcohol problems as a community approach to improving traffic safety. Washington, DC: NHTSA; 2013 DOT HS 811 836.
- Guide to Community Preventive Services. Reducing excessive alcohol use: increasing alcohol taxes. [cited 2016 Feb 5]. Available at URL: http://www.thecommunityguide.org/alcohol/increasingtaxes.html.
- Howat P, Sleet D, Smith I. Alcohol and driving: is the .05% blood alcohol concentration limit justified? Drug Alcohol Rev 1991;10(1):151-66.
- Wagenaar AC, Livingston MD, Staras SS. Effects of a 2009 Illinois alcohol tax increase on fatal motor vehicle crashes. Am J Public Health 2015;105(9):1880-5.
- Wagenaar AC, Maldonado-Molina MM, Ma L, et al. Effects of legal BAC limits on fatal crash involvement: analyses of 28 states from 1976 through 2002. J Safety Res 2007;38:493-9.
- Fell JC, Voas RB. The effectiveness of a 0.05 blood alcohol concentration (BAC) limit for driving in the United States. Addiction 2013;109:869-74.
- Blais E, Bellavance F, Marcil A, Carnis L. Effects of introducing an administrative .05% blood alcohol concentration limit on law enforcement patterns and alcohol-related collisions in Canada. Accid Anal Prev 2015;82:101-11.
- National Committee on Injury Prevention and Control. Injury prevention: meeting the challenge. New York, NY: Oxford University Press, 1989, p.124.
- Page last reviewed: June 16, 2017
- Page last updated: June 16, 2017
- Content source:
- Centers for Disease Control and Prevention,
- National Center for Injury Prevention and Control,
- Division of Unintentional Injury Prevention