

Charts
 ShareCompartir
Charts offer a way to show complex relationships so that the relationships can be seen quickly. Different charts are designed to most effectively portray certain types of information. It is important to choose the correct chart format for your information.
Currently only one chart type, a time series line chart, is available through the WCMS.
Line Chart
Line charts are typically used to show time series data. Line charts are useful for identifying patterns and trends in the data.
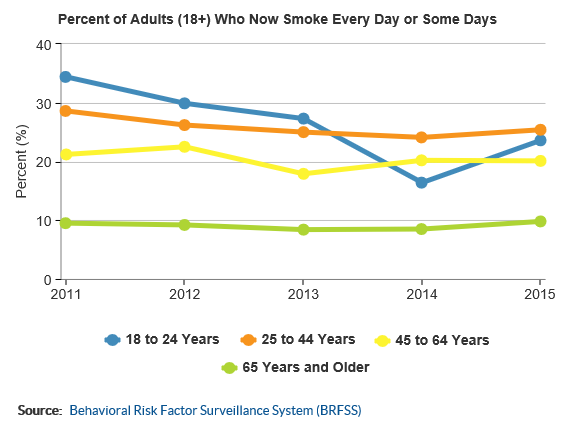
The line chart above shows Health Consequences and Costs – Smoking-Attributable Expenditures (SAEs) for 2005 to 2009.
- Page last reviewed: August 16, 2017
- Page last updated: August 16, 2017
- Content source: