

Tuberculosis Recommended Queries
 ShareCompartir
Download TB slideset: pdf version | PowerPoint version
Slide 1
Division of Tuberculosis Elimination scientific staff were asked to highlight some of the most important data. In this notes area of the powerpoint, each slide contains the title (with the variables selected), some contextual information, and links to additional data and information on the topic.
All of the NCHHSTP Atlas maps are choropleth maps, which use sequential colors (e.g., light blue to dark blue) to display data that progress from low to high values. Typically, one uses light colors for low data values and dark colors for high data values.
Slide 2
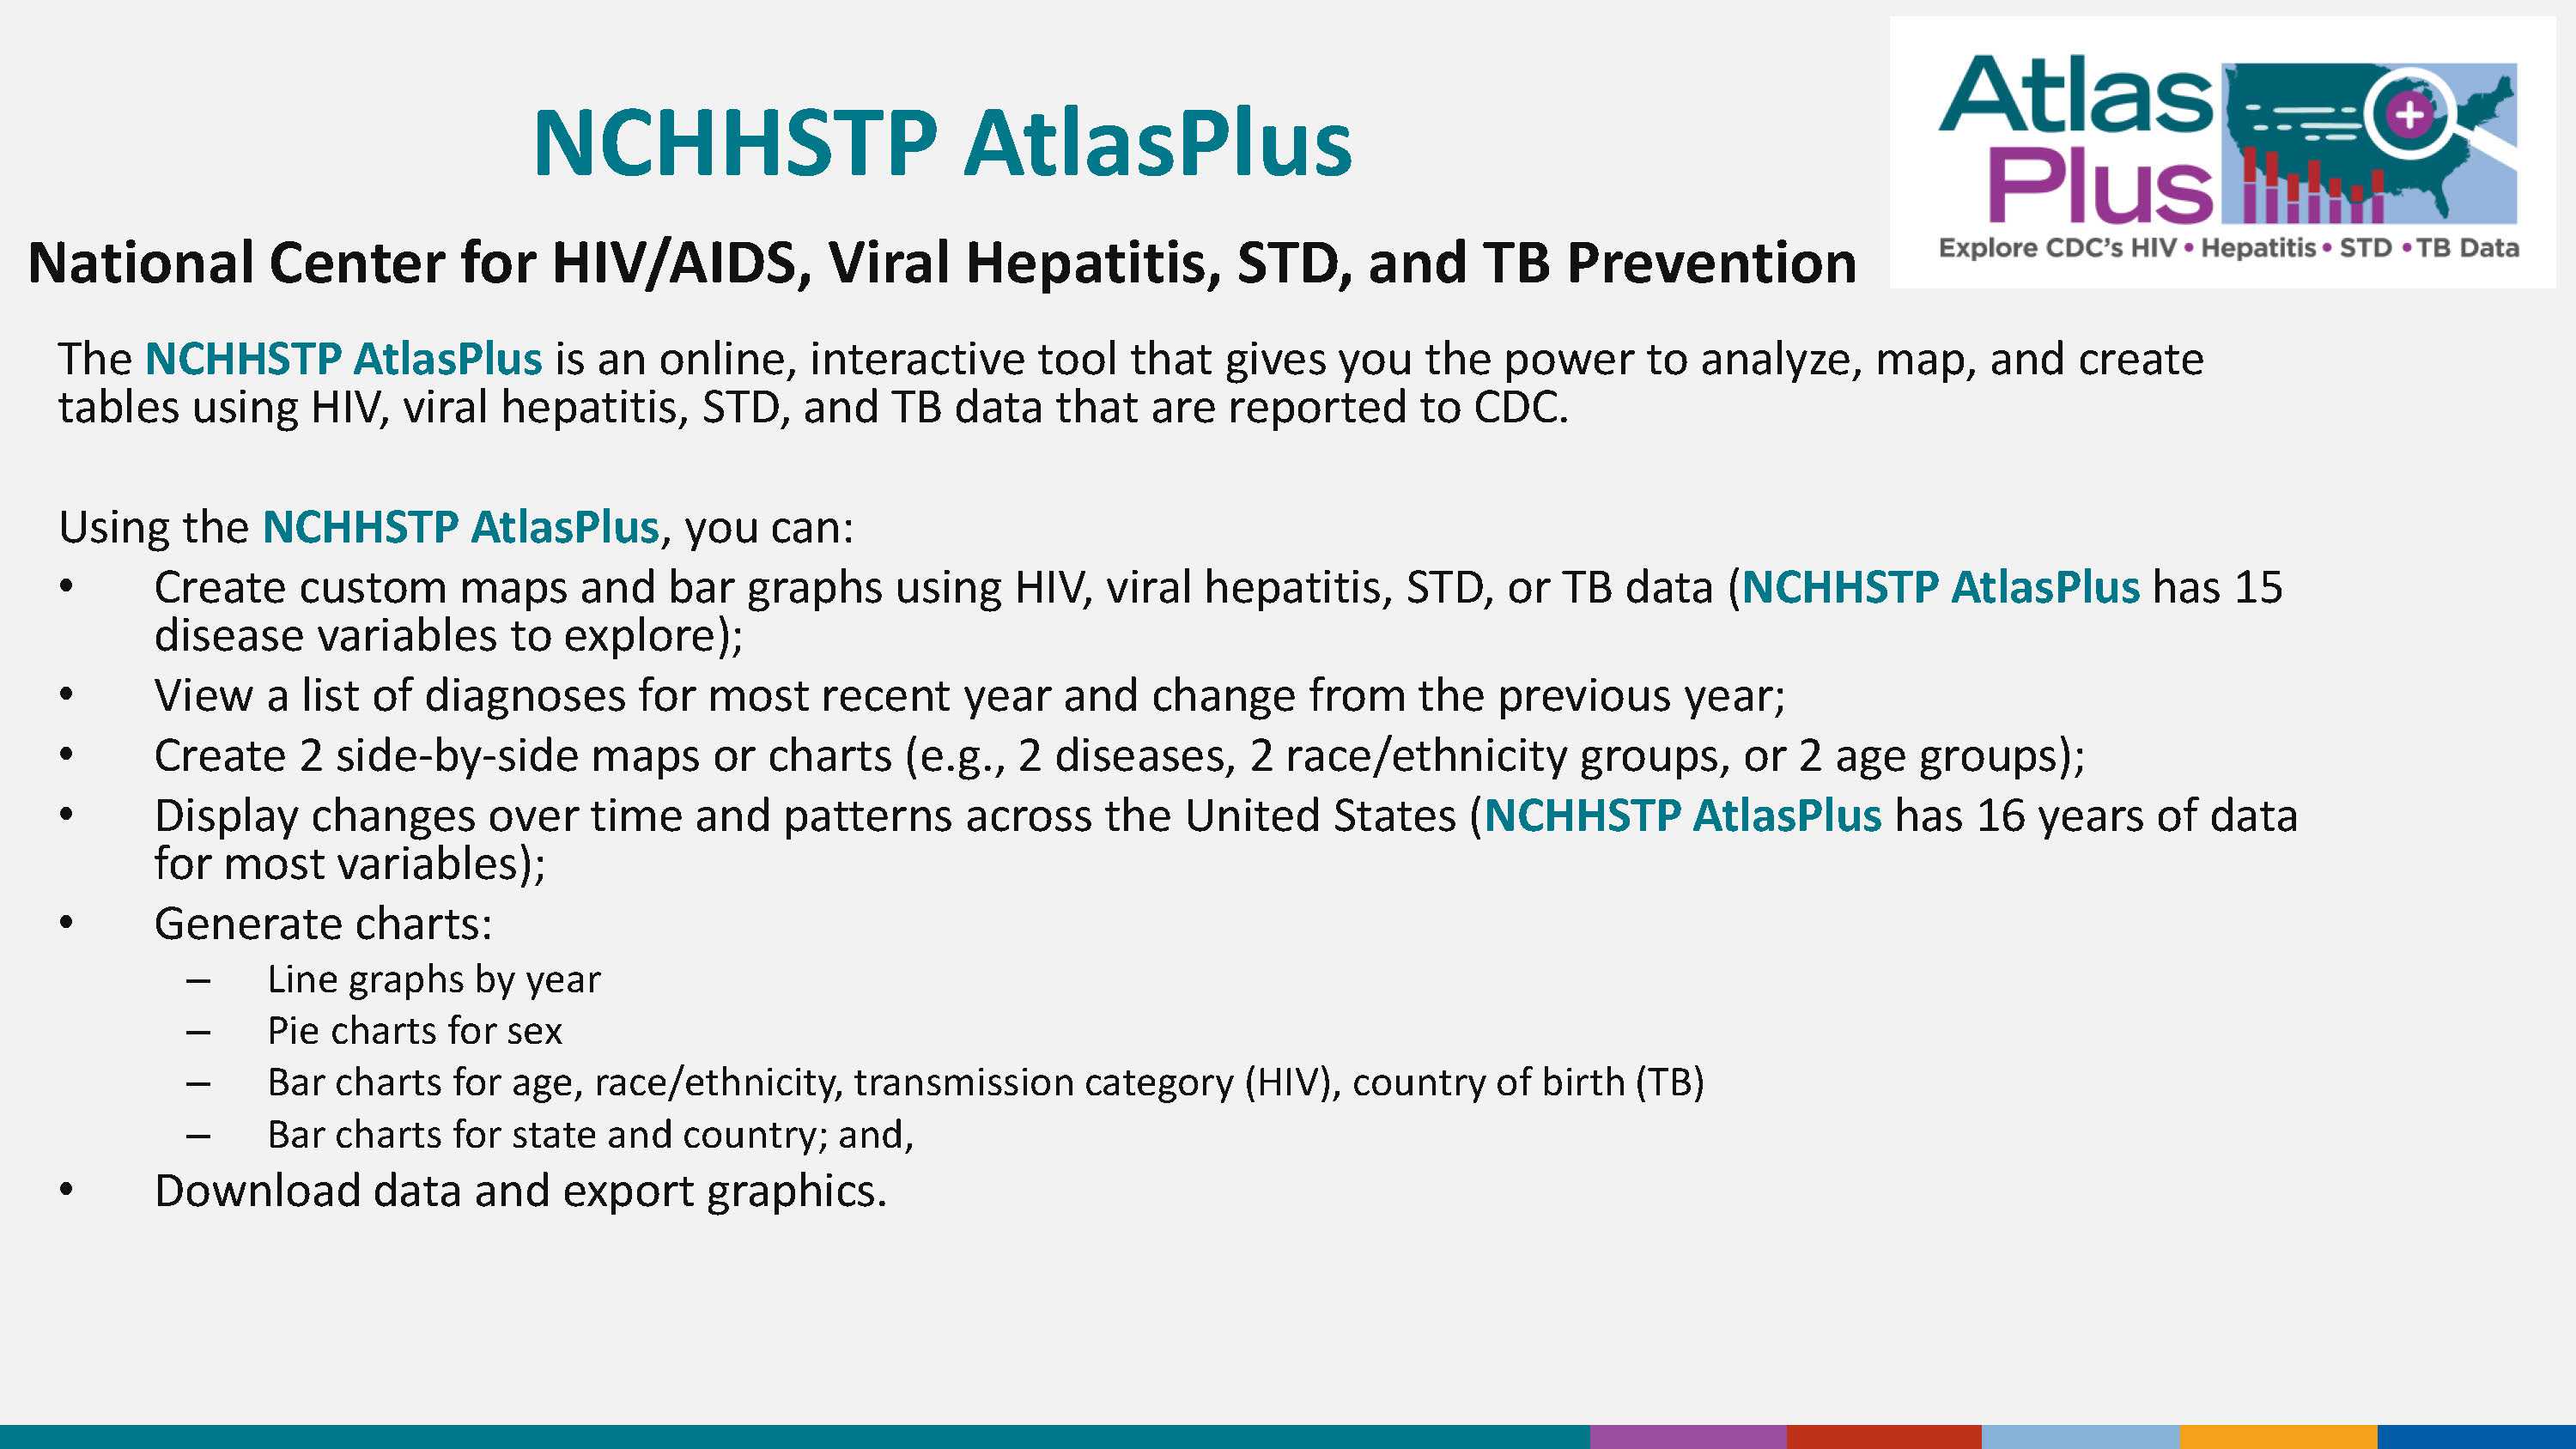
The NCHHSTP AtlasPlus is an online, interactive tool that gives you the power to analyze, map, and create tables using HIV, viral hepatitis, STD, and TB data that are reported to CDC.
Using the NCHHSTP AtlasPlus, you can:
- Create custom maps and bar graphs using HIV, viral hepatitis, STD, or TB data (NCHHSTP AtlasPlus has 15 disease variables to explore);
- View a list of diagnoses for most recent year and change from the previous year;
- Create 2 side-by-side maps or charts (e.g., 2 diseases, 2 race/ethnicity groups, or 2 age groups);
- Display changes over time and patterns across the United States (NCHHSTP AtlasPlus has 16 years of data for most variables);
- Generate charts:
- Line graphs by year
- Pie charts for sex
- Bar charts for age, race/ethnicity, transmission category (HIV), country of birth (TB)
- Bar charts for state and country; and,
- Download data and export graphics.
Slide 3

TB cases in 50 states, DC and 5 dependent areas, 2015, by state
The modern era of TB surveillance began in 1993, and cases declined each year between 1993 and 2014. In 2015, cases increased over the previous year for the first time to a total of 9,557 cases. However, the incidence rate remained stable at approximately 3.0 cases per 100,000 population.
For more information: https://www.cdc.gov/tb/publications/factsheets/statistics/TBTrends.htm
Slide 4
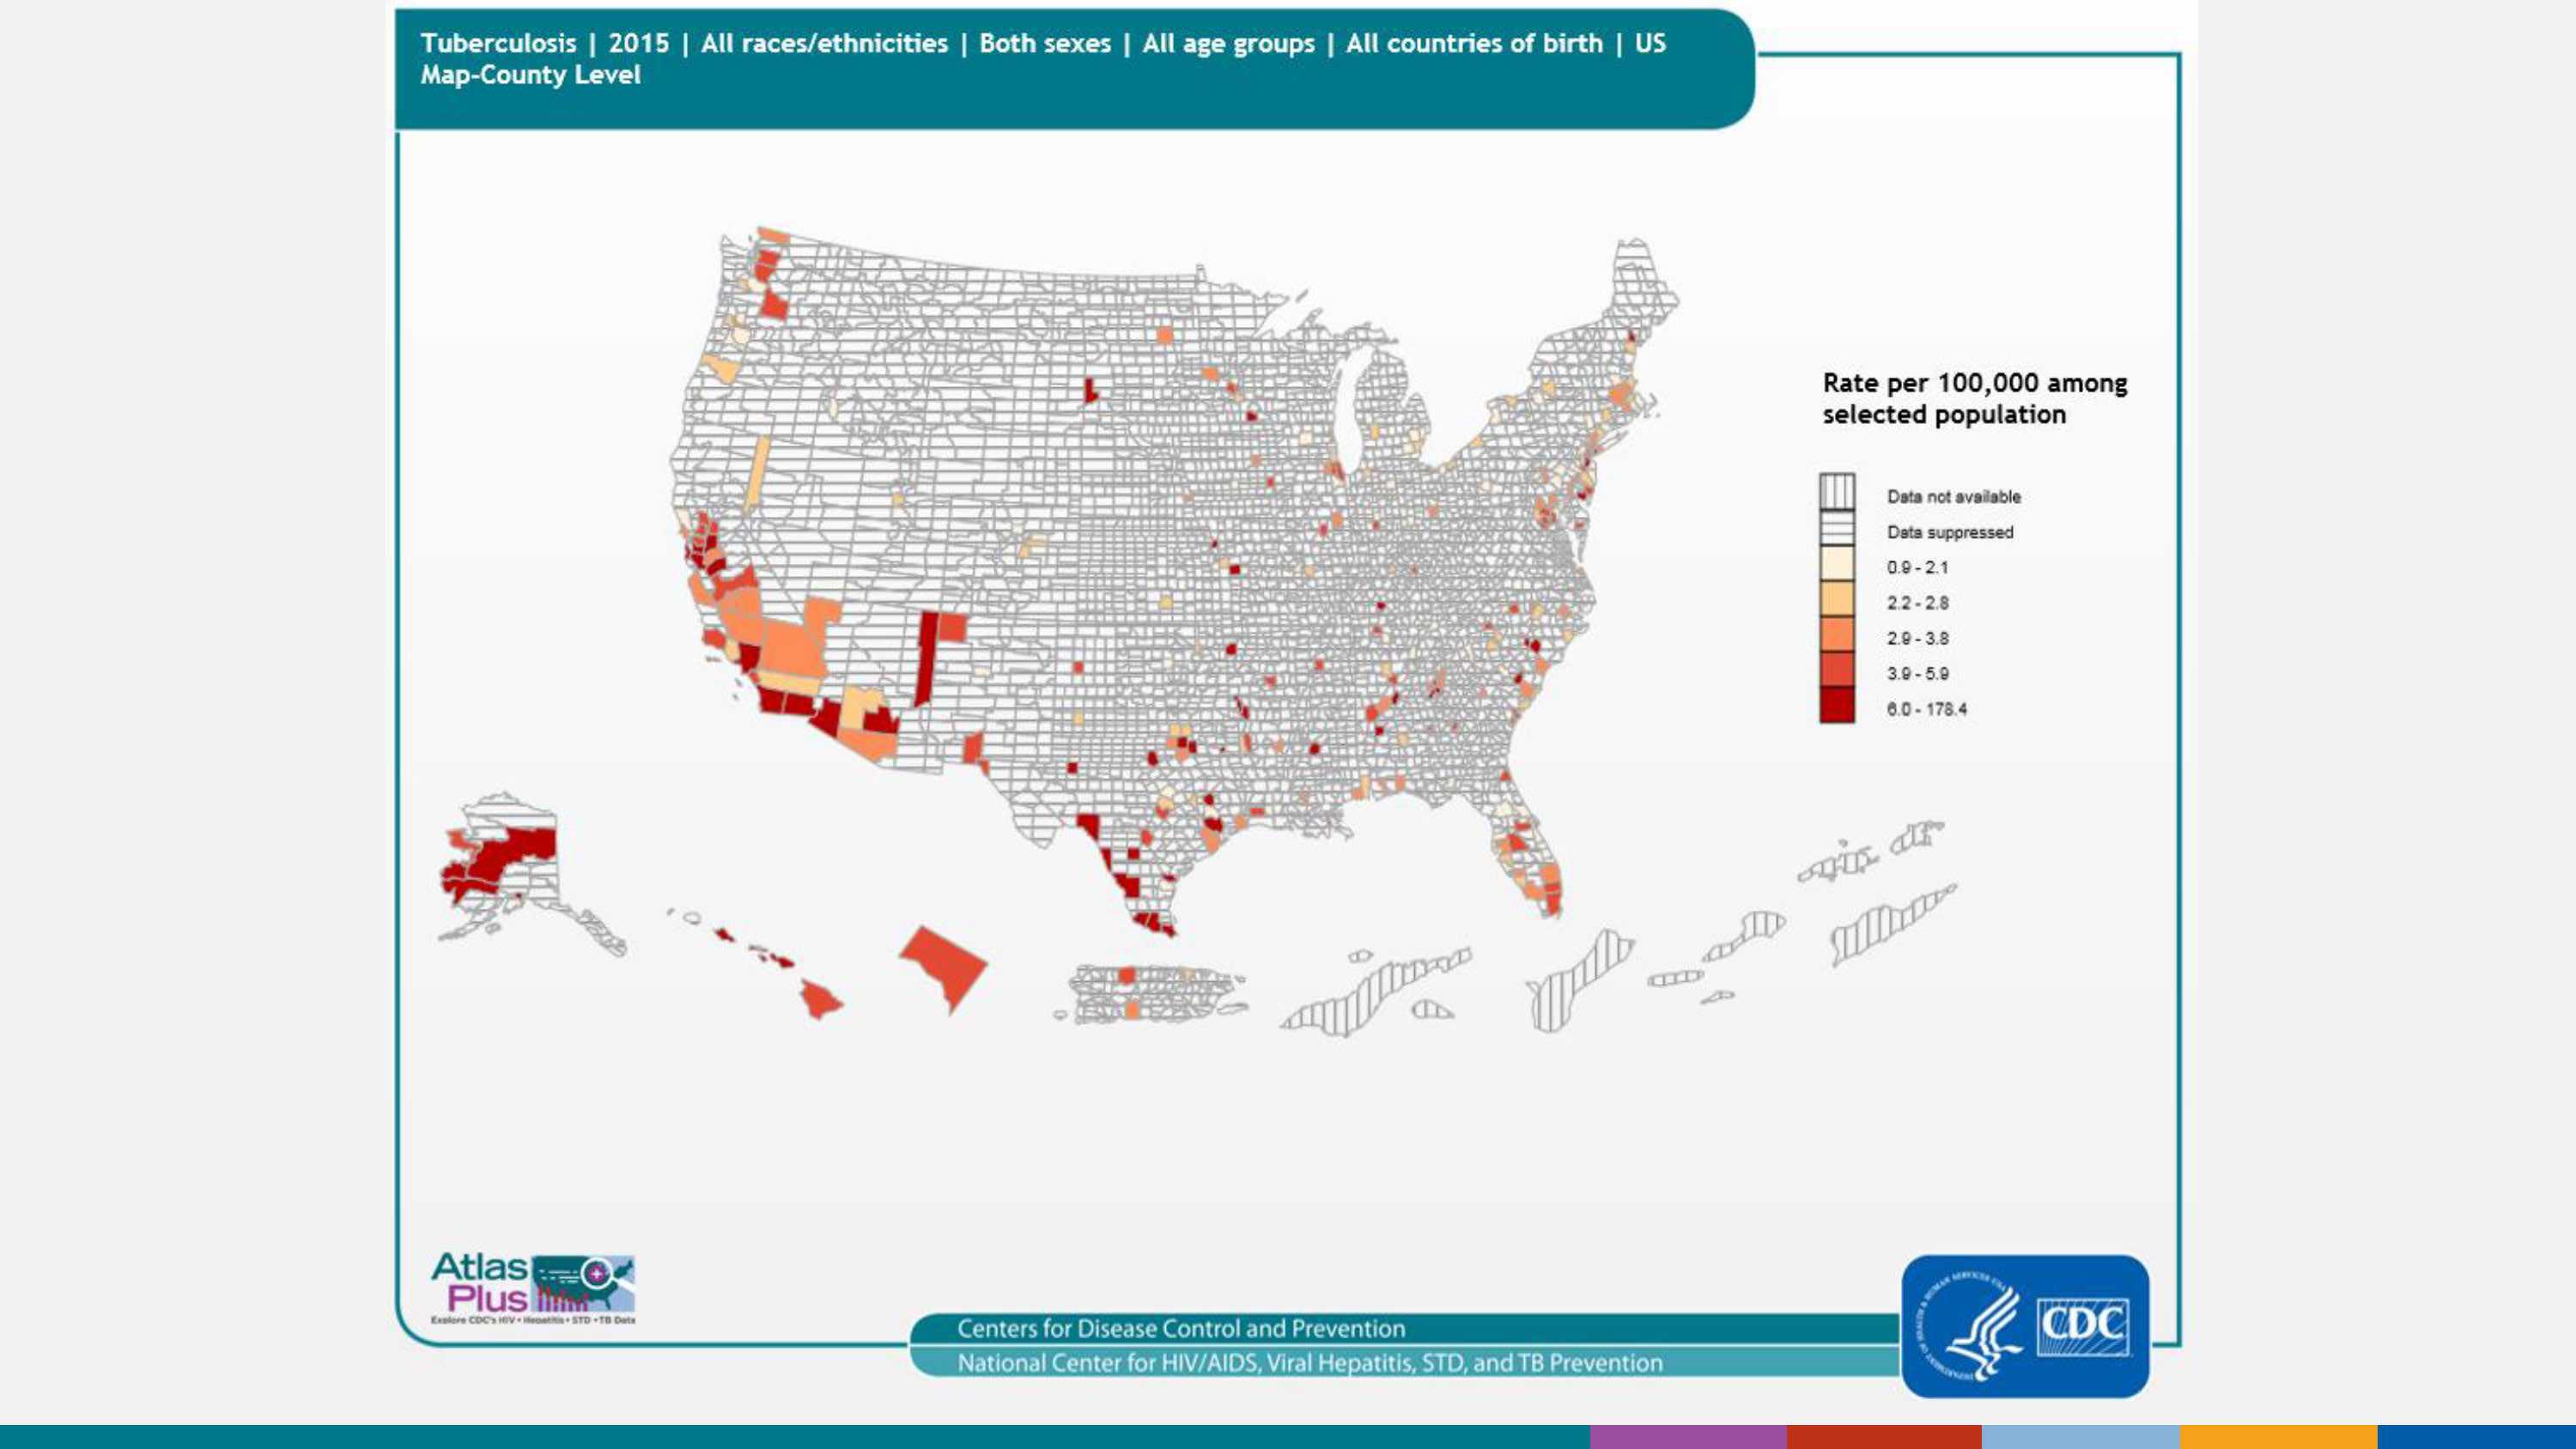
TB cases in 50 states and DC, 2015, by county
County-level data can illustrate patterns of TB cases within states, as well as cross-state patterns and networks affecting public health (compare this map to the previous one). As seen in the map, many counties have suppressed data (meaning that the numerator/case count is less than 5), so a pattern is difficult to discern.
For more information: https://www.cdc.gov/tb/publications/factsheets/statistics/TBTrends.htm
Slide 5
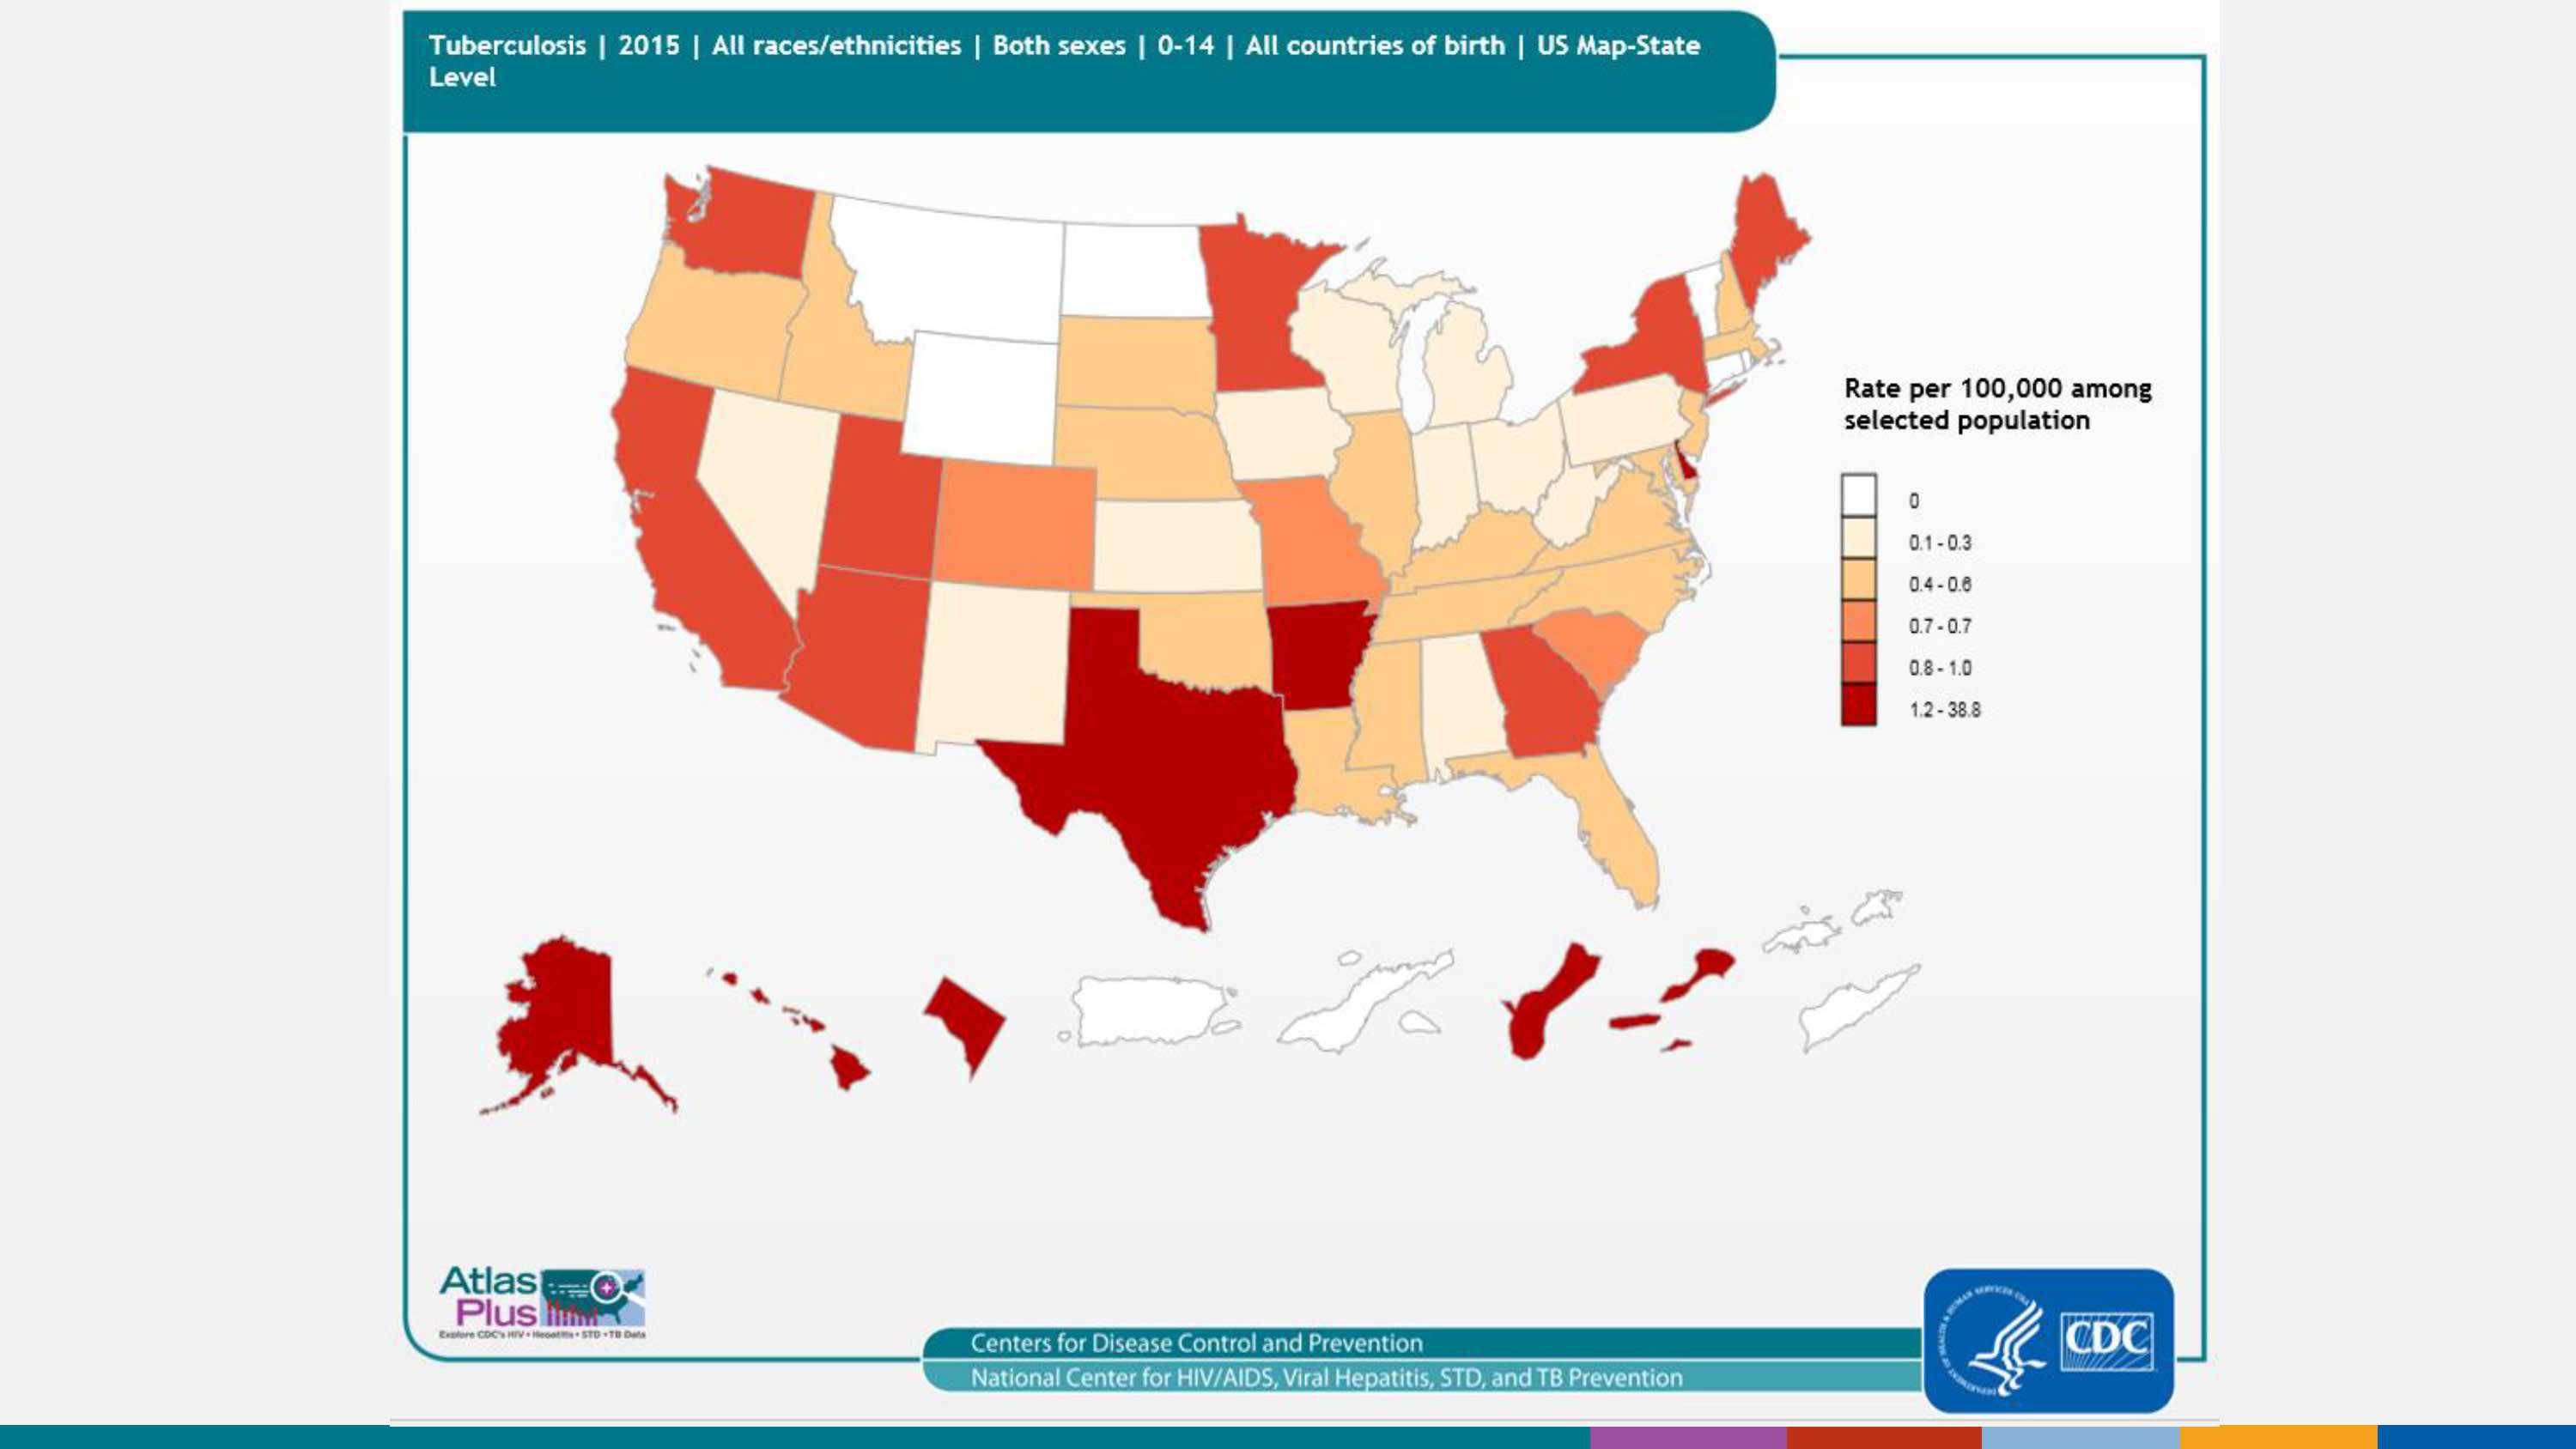
TB pediatric cases (ages 0-14), 50 states, DC and 5 dependent areas, 2015, by state
TB disease in children under 15 years of age (also called pediatric tuberculosis) is a public health problem of special significance because TB in a young child is a marker for recent transmission of TB. As seen in the map, the highest rates of pediatric TB are in Alaska, Arkansas, DC, Delaware, Hawaii, Puerto Rico, Texas, and the US Virgin Islands.
For more information: https://www.cdc.gov/tb/topic/populations/TBinChildren/default.htm
Slide 6
Disclaimer: This is a user-generated report. The findings and conclusions are those of the user and do not necessarily represent the views of the CDC.
Notes: TB case report data are submitted from all 50 states, the District of Columbia, and 5 dependent areas. These data are summarized by disease, year, age group, sex, race/ethnicity, and origin of birth. Rates per 100,000 population were calculated for TB. The population denominators used to compute these rates for the 50 states and the District of Columbia were based on the U.S. Census population estimates. Due to lack of data from the U.S. Census Bureau and small cell sizes, rates are not calculated for the dependent areas (except for Puerto Rico). Cell suppression: CDC follows the 2005 data sharing agreement rules for TB data. For TB data, the data suppression rule is applied when the numerator for a given state is 5 or less. When suppressed, data are only displayed by state totals and breakdown by demographic characteristics is not permitted. Suggested citation: Centers for Disease Control and Prevention (CDC) NCHHSTP AtlasPlus. Accessed on
For more info, see: TB Surveillance Technical Notes.
Slide 7
To learn more about the diseases:
- HIV
- Chlamydia, Gonorrhea, Syphilis
- Acute Viral Hepatitis A, Acute Viral Hepatitis B, and Acute Viral Hepatitis C
- Tuberculosis (TB)
For data sources:
- Page last reviewed: April 6, 2017
- Page last updated: April 6, 2017
- Content source: