

HIV Recommended Queries
 ShareCompartir
Download HIV slideset: pdf version | PowerPoint version
Slide 1
Division of HIV/AIDS Prevention scientific staff drafted these to highlight some of the most important data. In this notes area of the PowerPoint slides, each slide contains the title (with the variables selected), some contextual information, and links to additional data and information on the topic.
Note: Data displayed are for individuals 13 years of age or older, and therefore may not reflect the numbers and rates provided in the HIV Surveillance Reports which include data for children.
All of the NCHHSTP AtlasPlus maps are choropleth maps, which use sequential colors (e.g., light blue to dark blue) to display data that progress from low to high values. Typically, one uses light colors for low data values and dark colors for high data values.
Slide 2
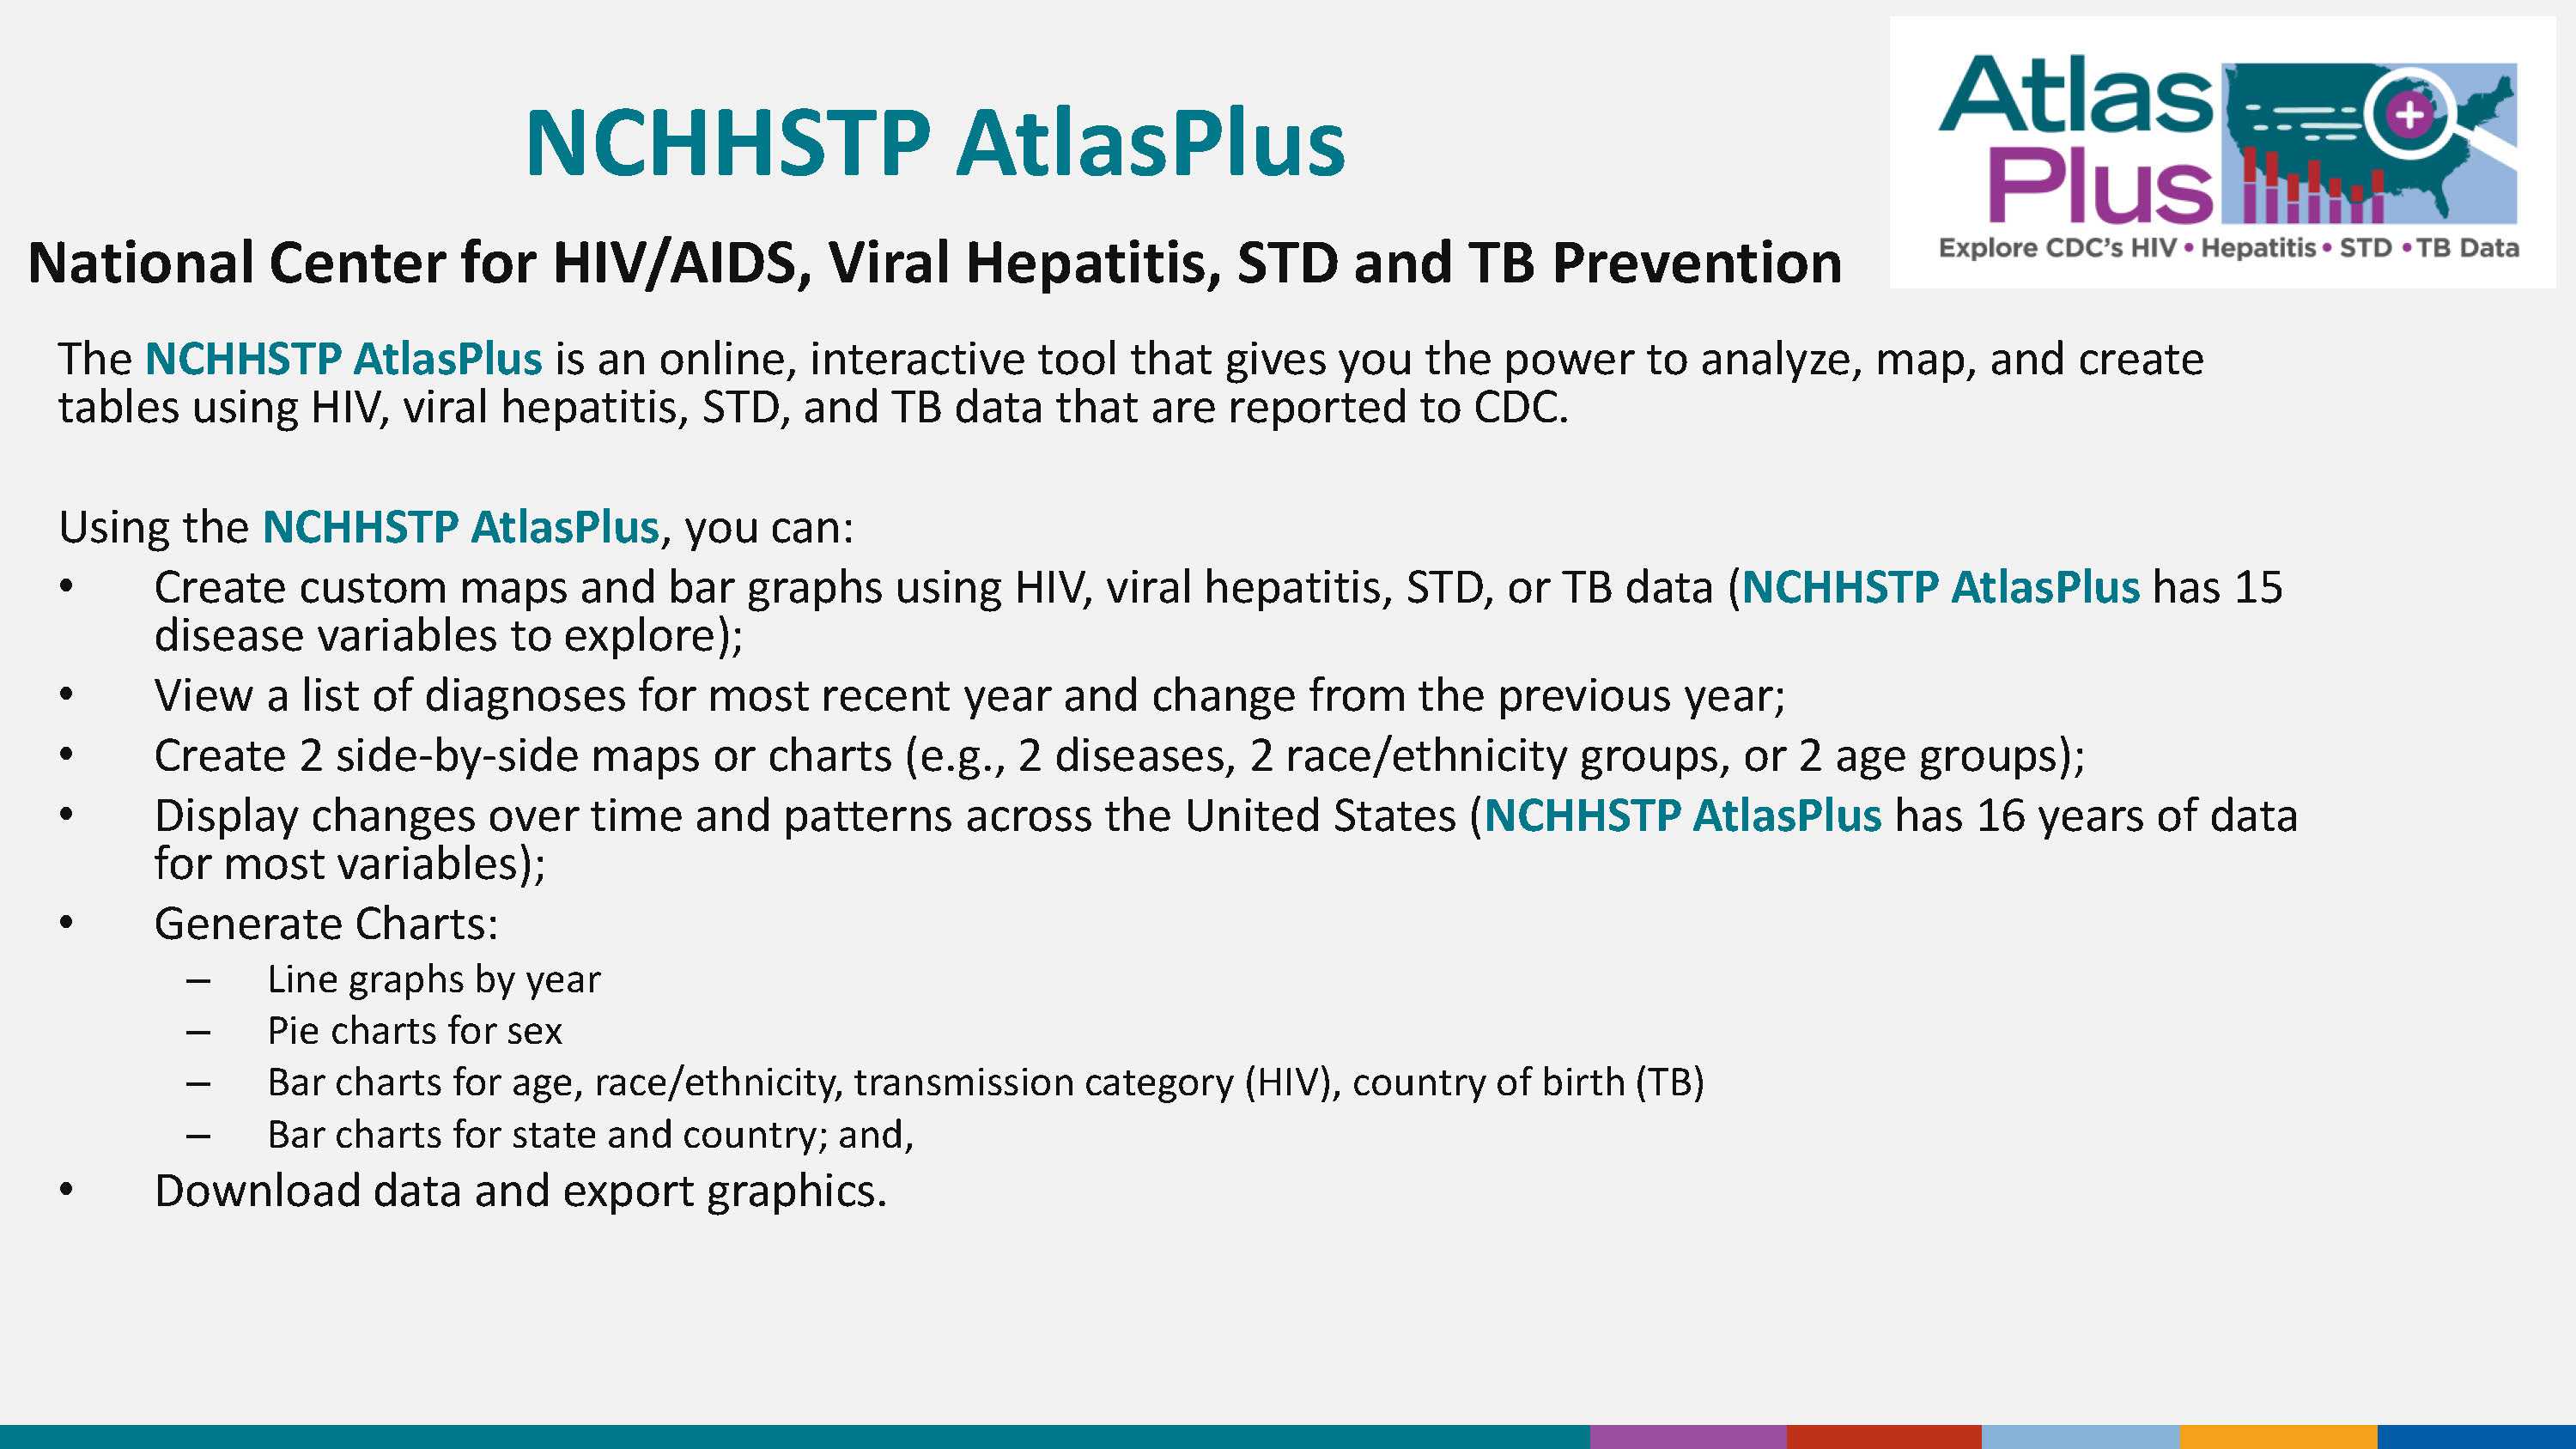
The NCHHSTP AtlasPlus is an online, interactive tool that gives you the power to analyze, map, and create tables using HIV, viral hepatitis, STD, and TB data that are reported to CDC.
Using the NCHHSTP Atlas, you can:
- Create custom maps and bar graphs using HIV, viral hepatitis, STD, or TB data (NCHHSTP AtlasPlus has 15 disease variables to explore);
- View a list of diagnoses for most recent year and change from the previous year;
- Create 2 side-by-side maps or charts (e.g., 2 diseases, 2 race/ethnicity groups, or 2 age groups);
- Display changes over time and patterns across the United States (NCHHSTP AtlasPlus has 16 years of data for most variables);
- Generate Charts:
- Line graphs by year
- Pie charts for sex
- Bar charts for age, race/ethnicity, transmission category (HIV), country of birth (TB)
- Bar charts for state and country; and,
- Download data and export graphics.
Slide 3
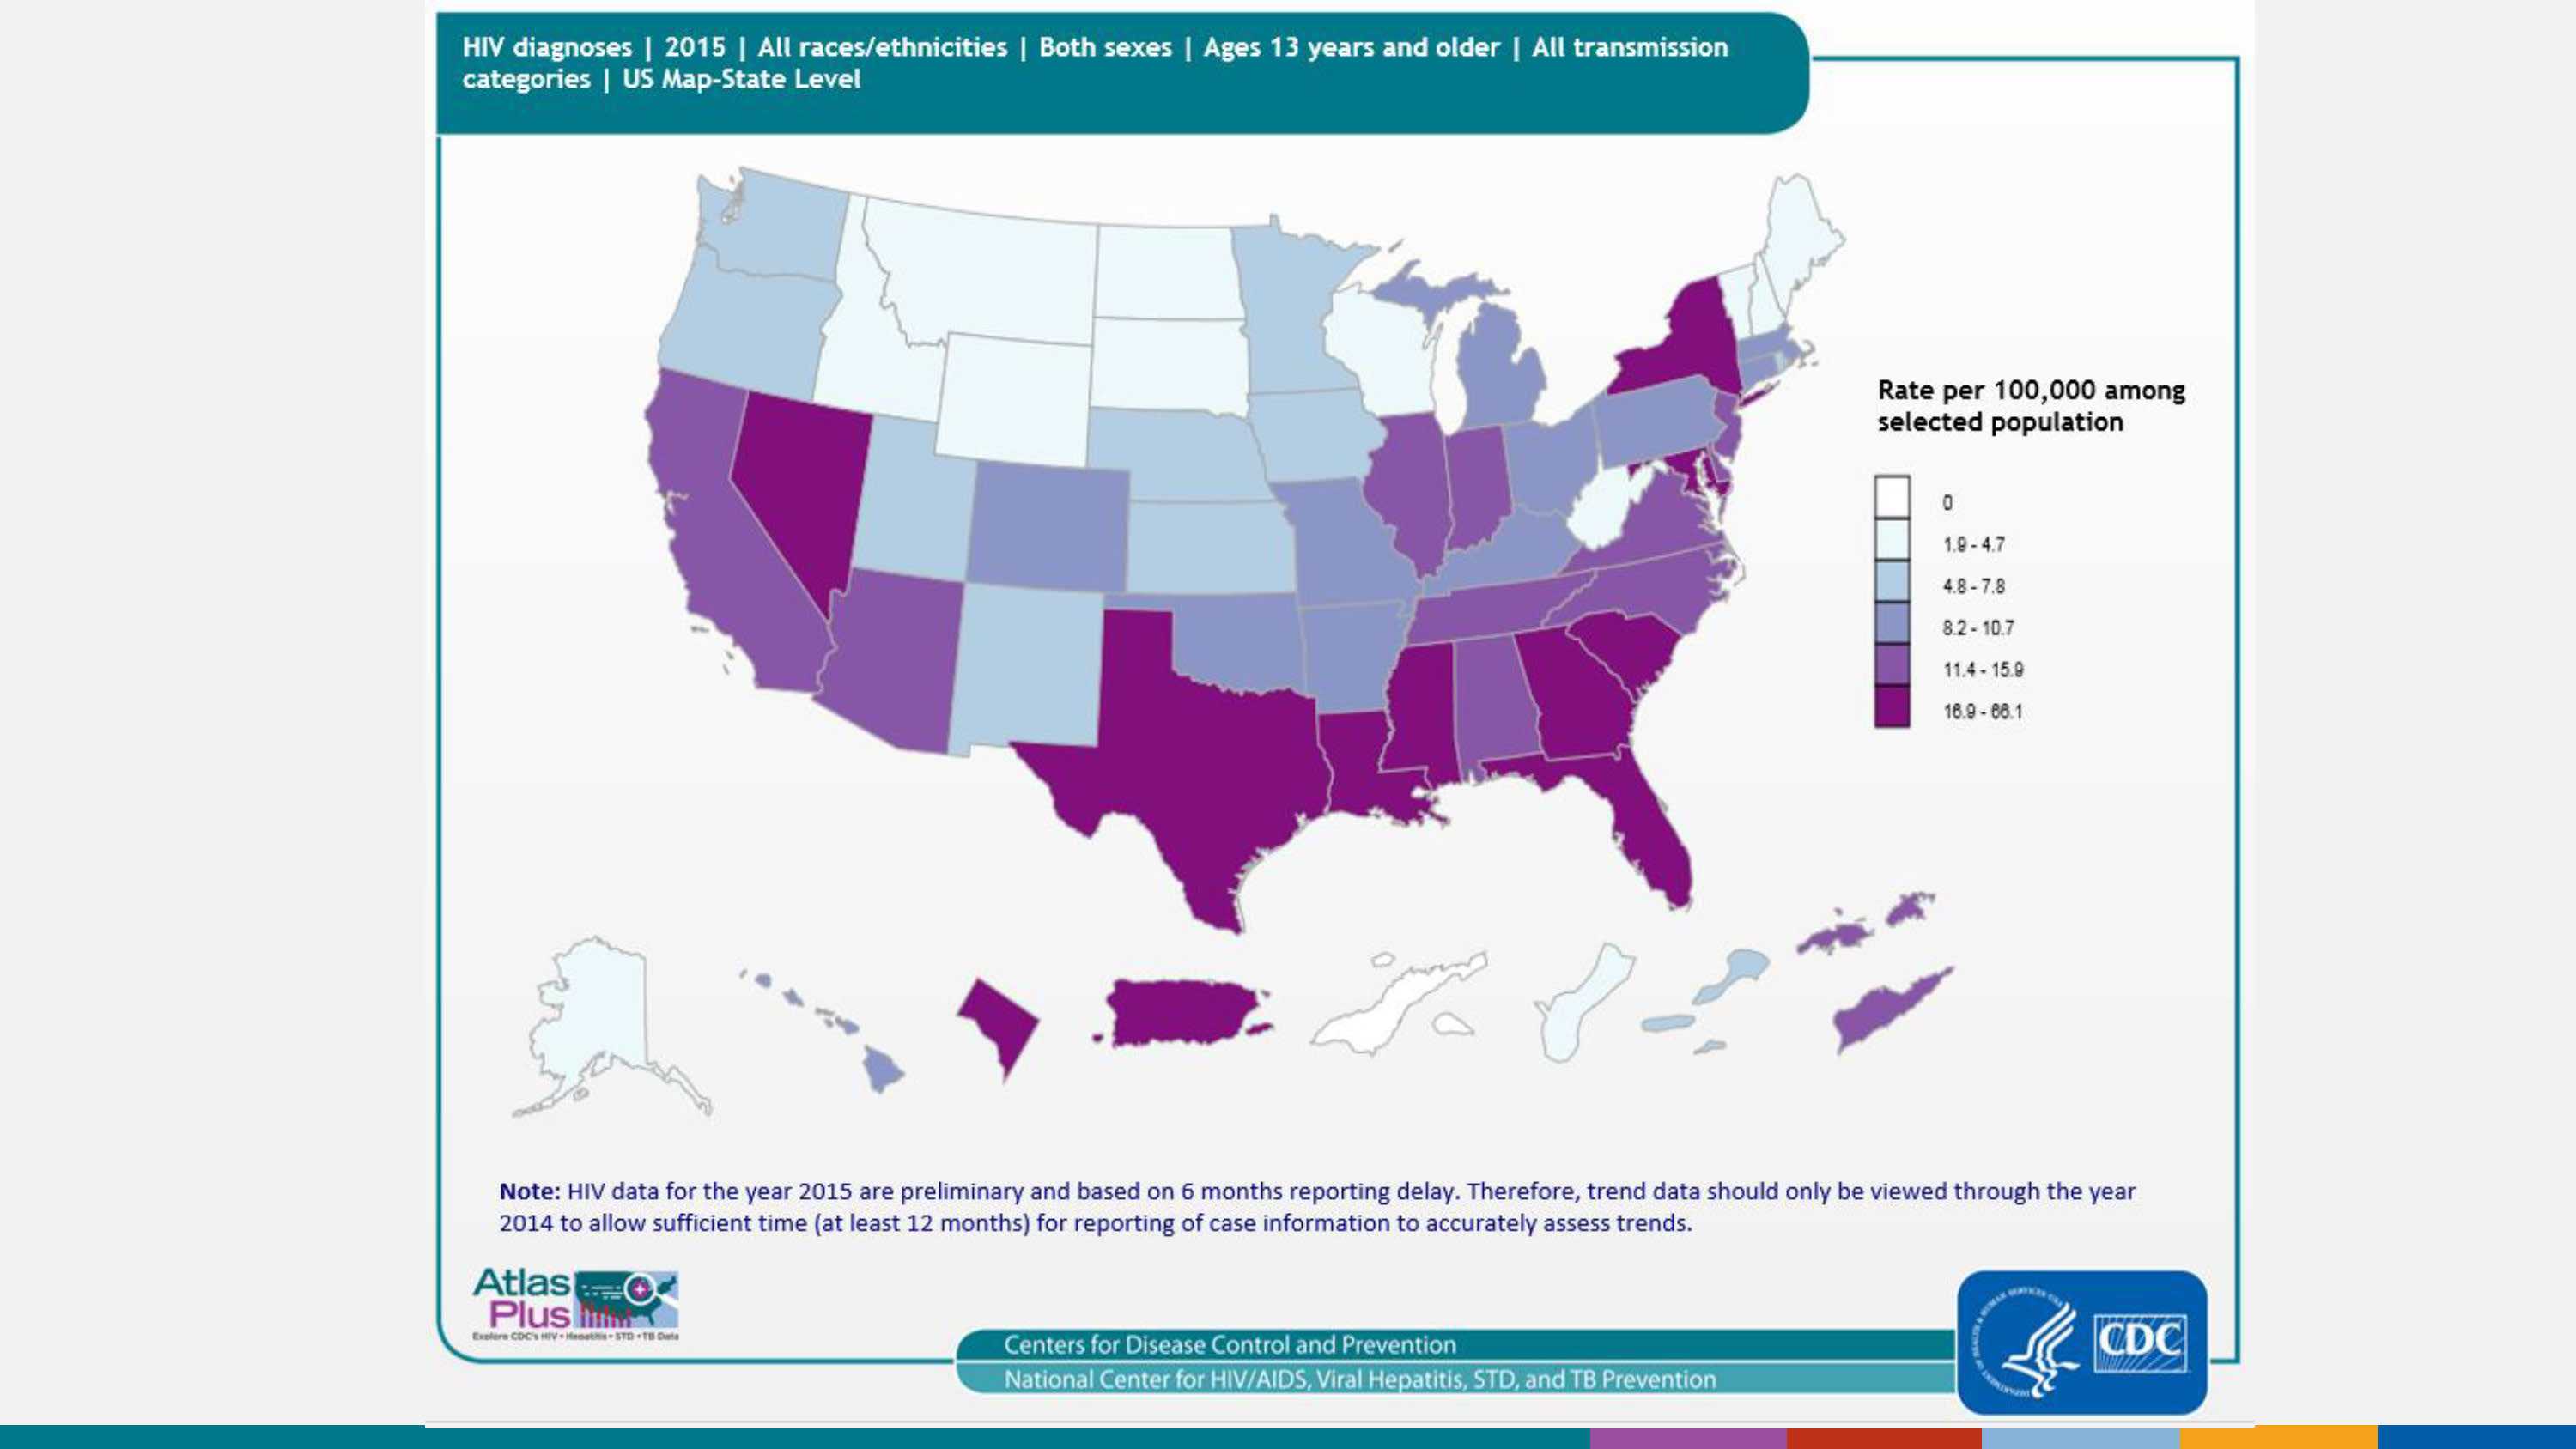
HIV diagnoses, 2015 — United States and 5 dependent areas, by state/area
From 2008 through 2015, the annual number and rate of diagnoses of HIV infection among adults and adolescents remained stable in the United States and 5 dependent areas; in 2015, 39,393 persons were diagnosed with HIV infection. As seen in the map, the highest rates were in the southern and northeastern regions of the United States and in Puerto Rico. For more information: https://www.cdc.gov/hiv/library/reports/surveillance/index.html
Slide 4
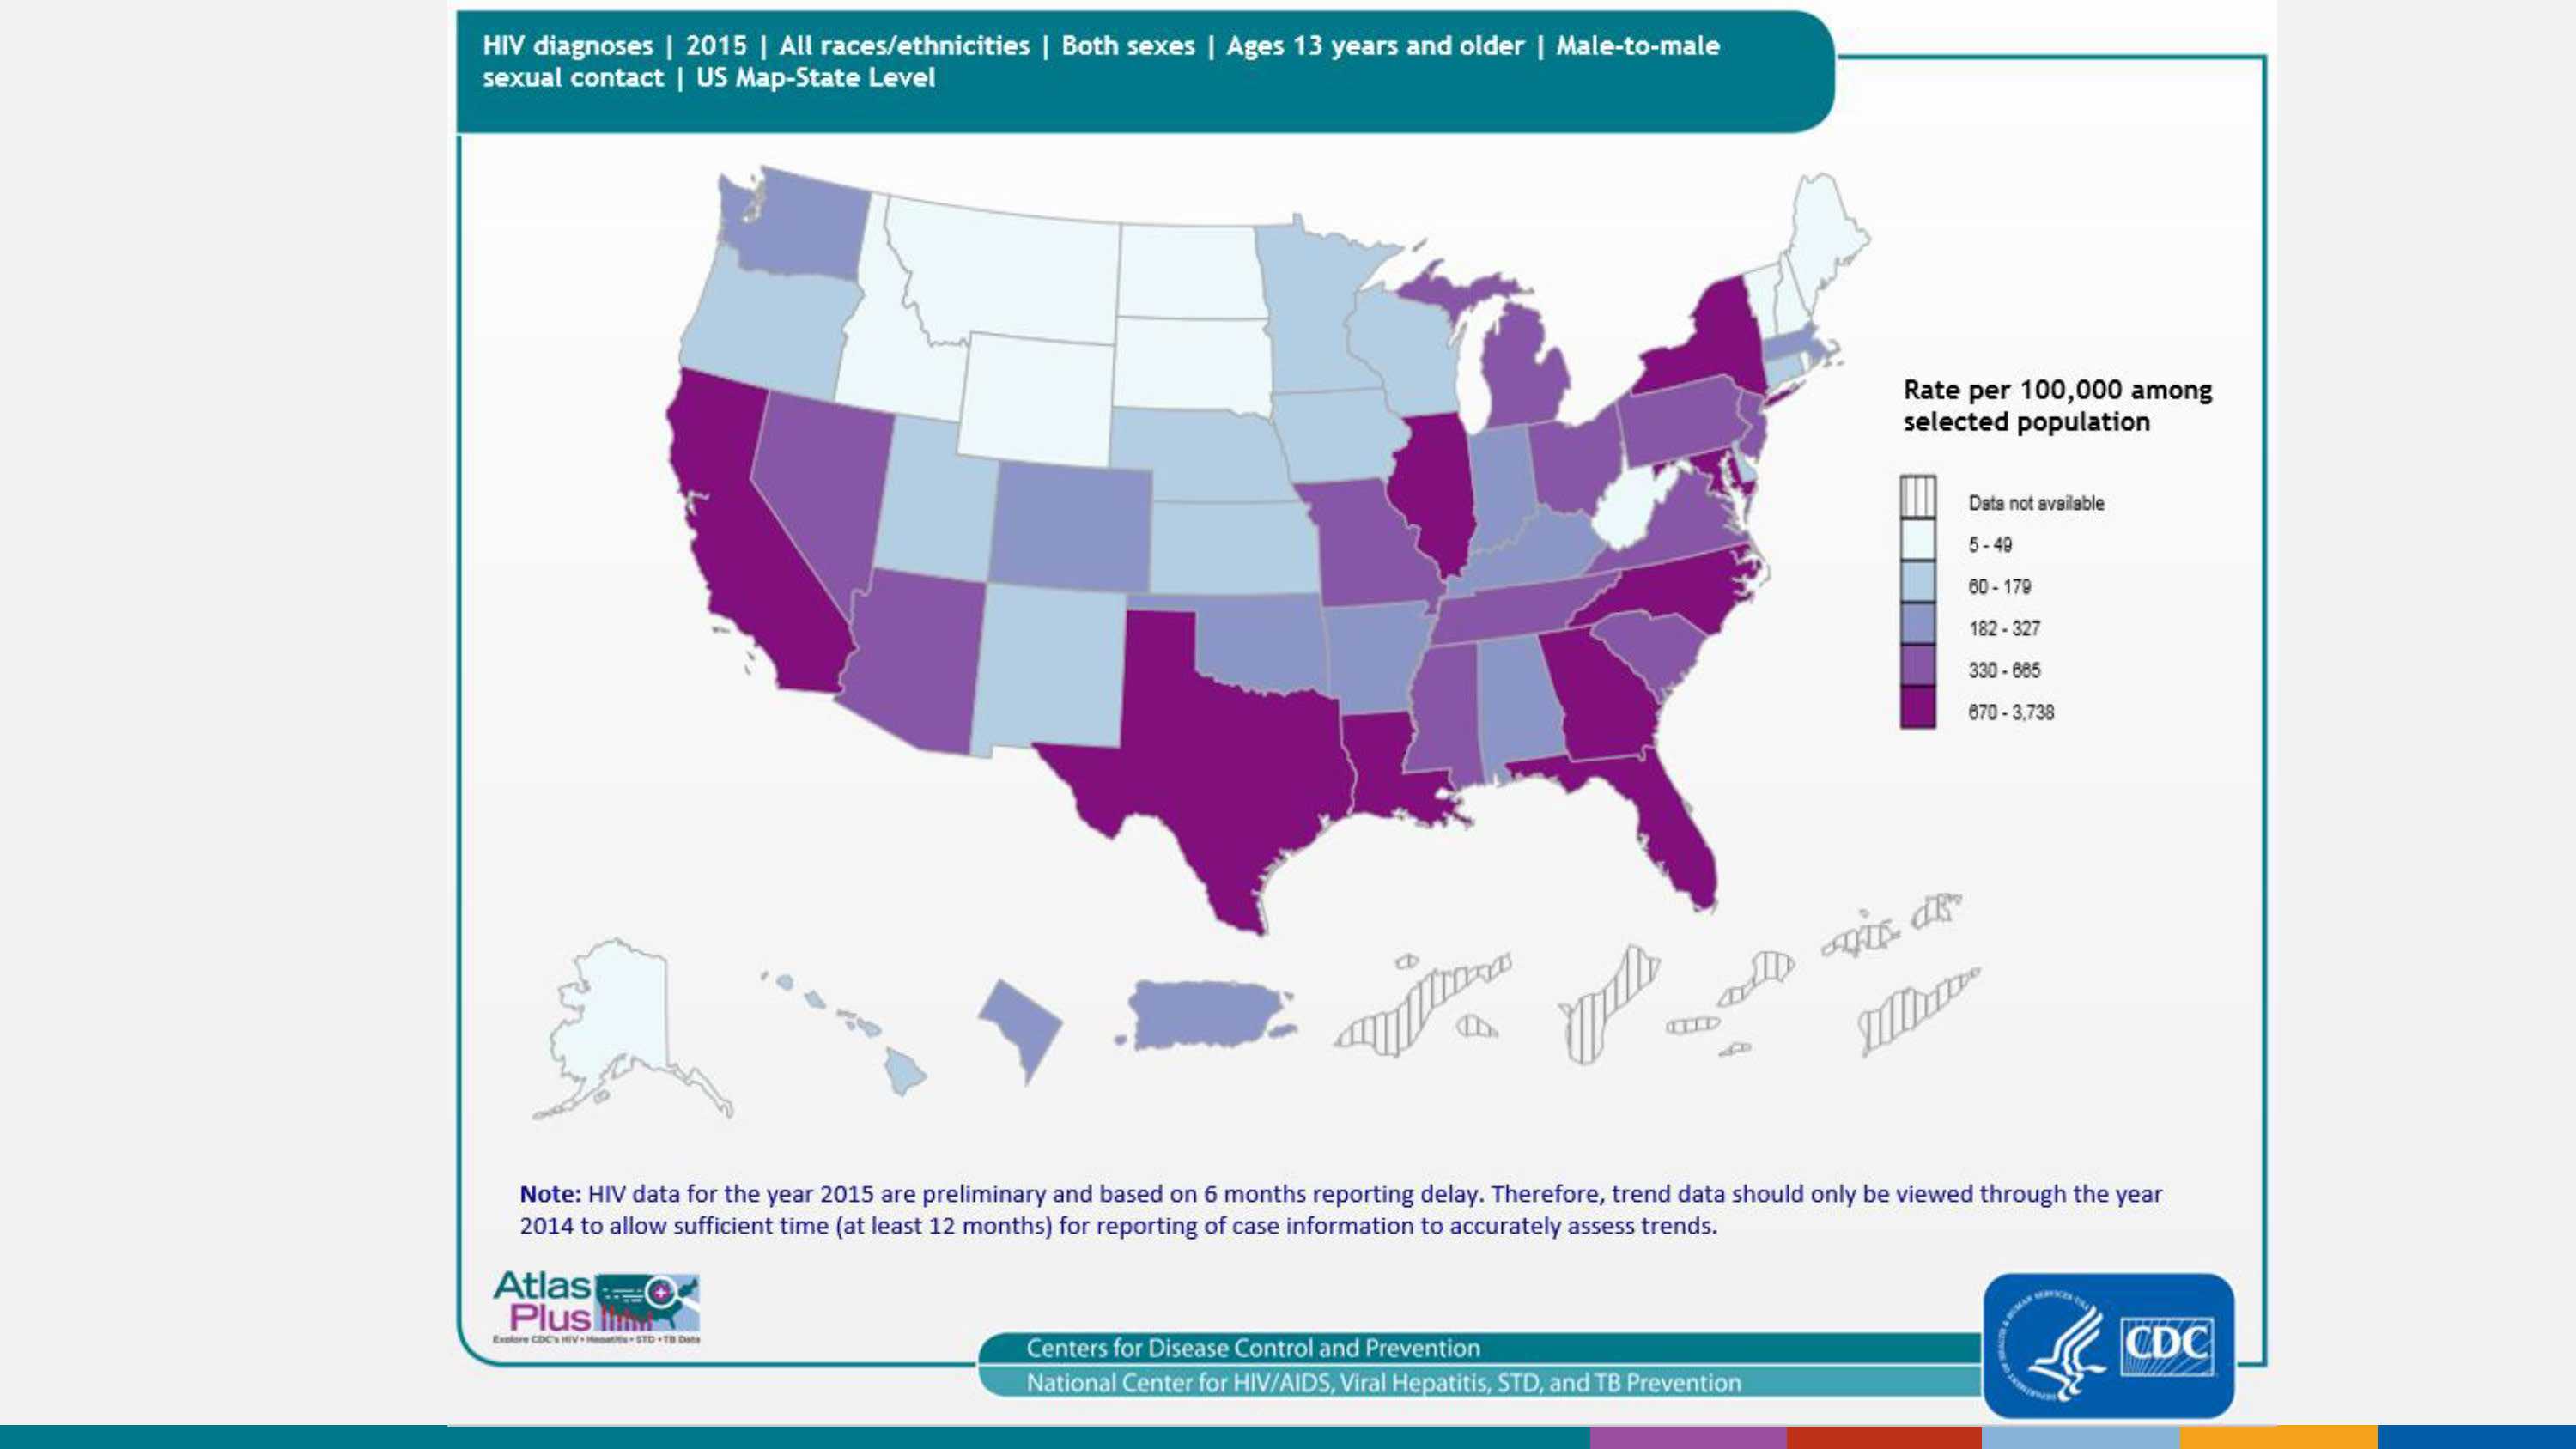
HIV diagnoses attributed to male-to-male sexual contact, 2015 — United States and 5 dependent areas, by state/area
In 2015, diagnosed HIV infection attributed to male-to-male sexual contact accounted for approximately 67% of diagnosed HIV infections in the United States. As seen in the map, the highest number of cases were in the eastern United States, Texas, Illinois, and California.
For more information: https://www.cdc.gov/hiv/library/reports/surveillance/index.html
Slide 5
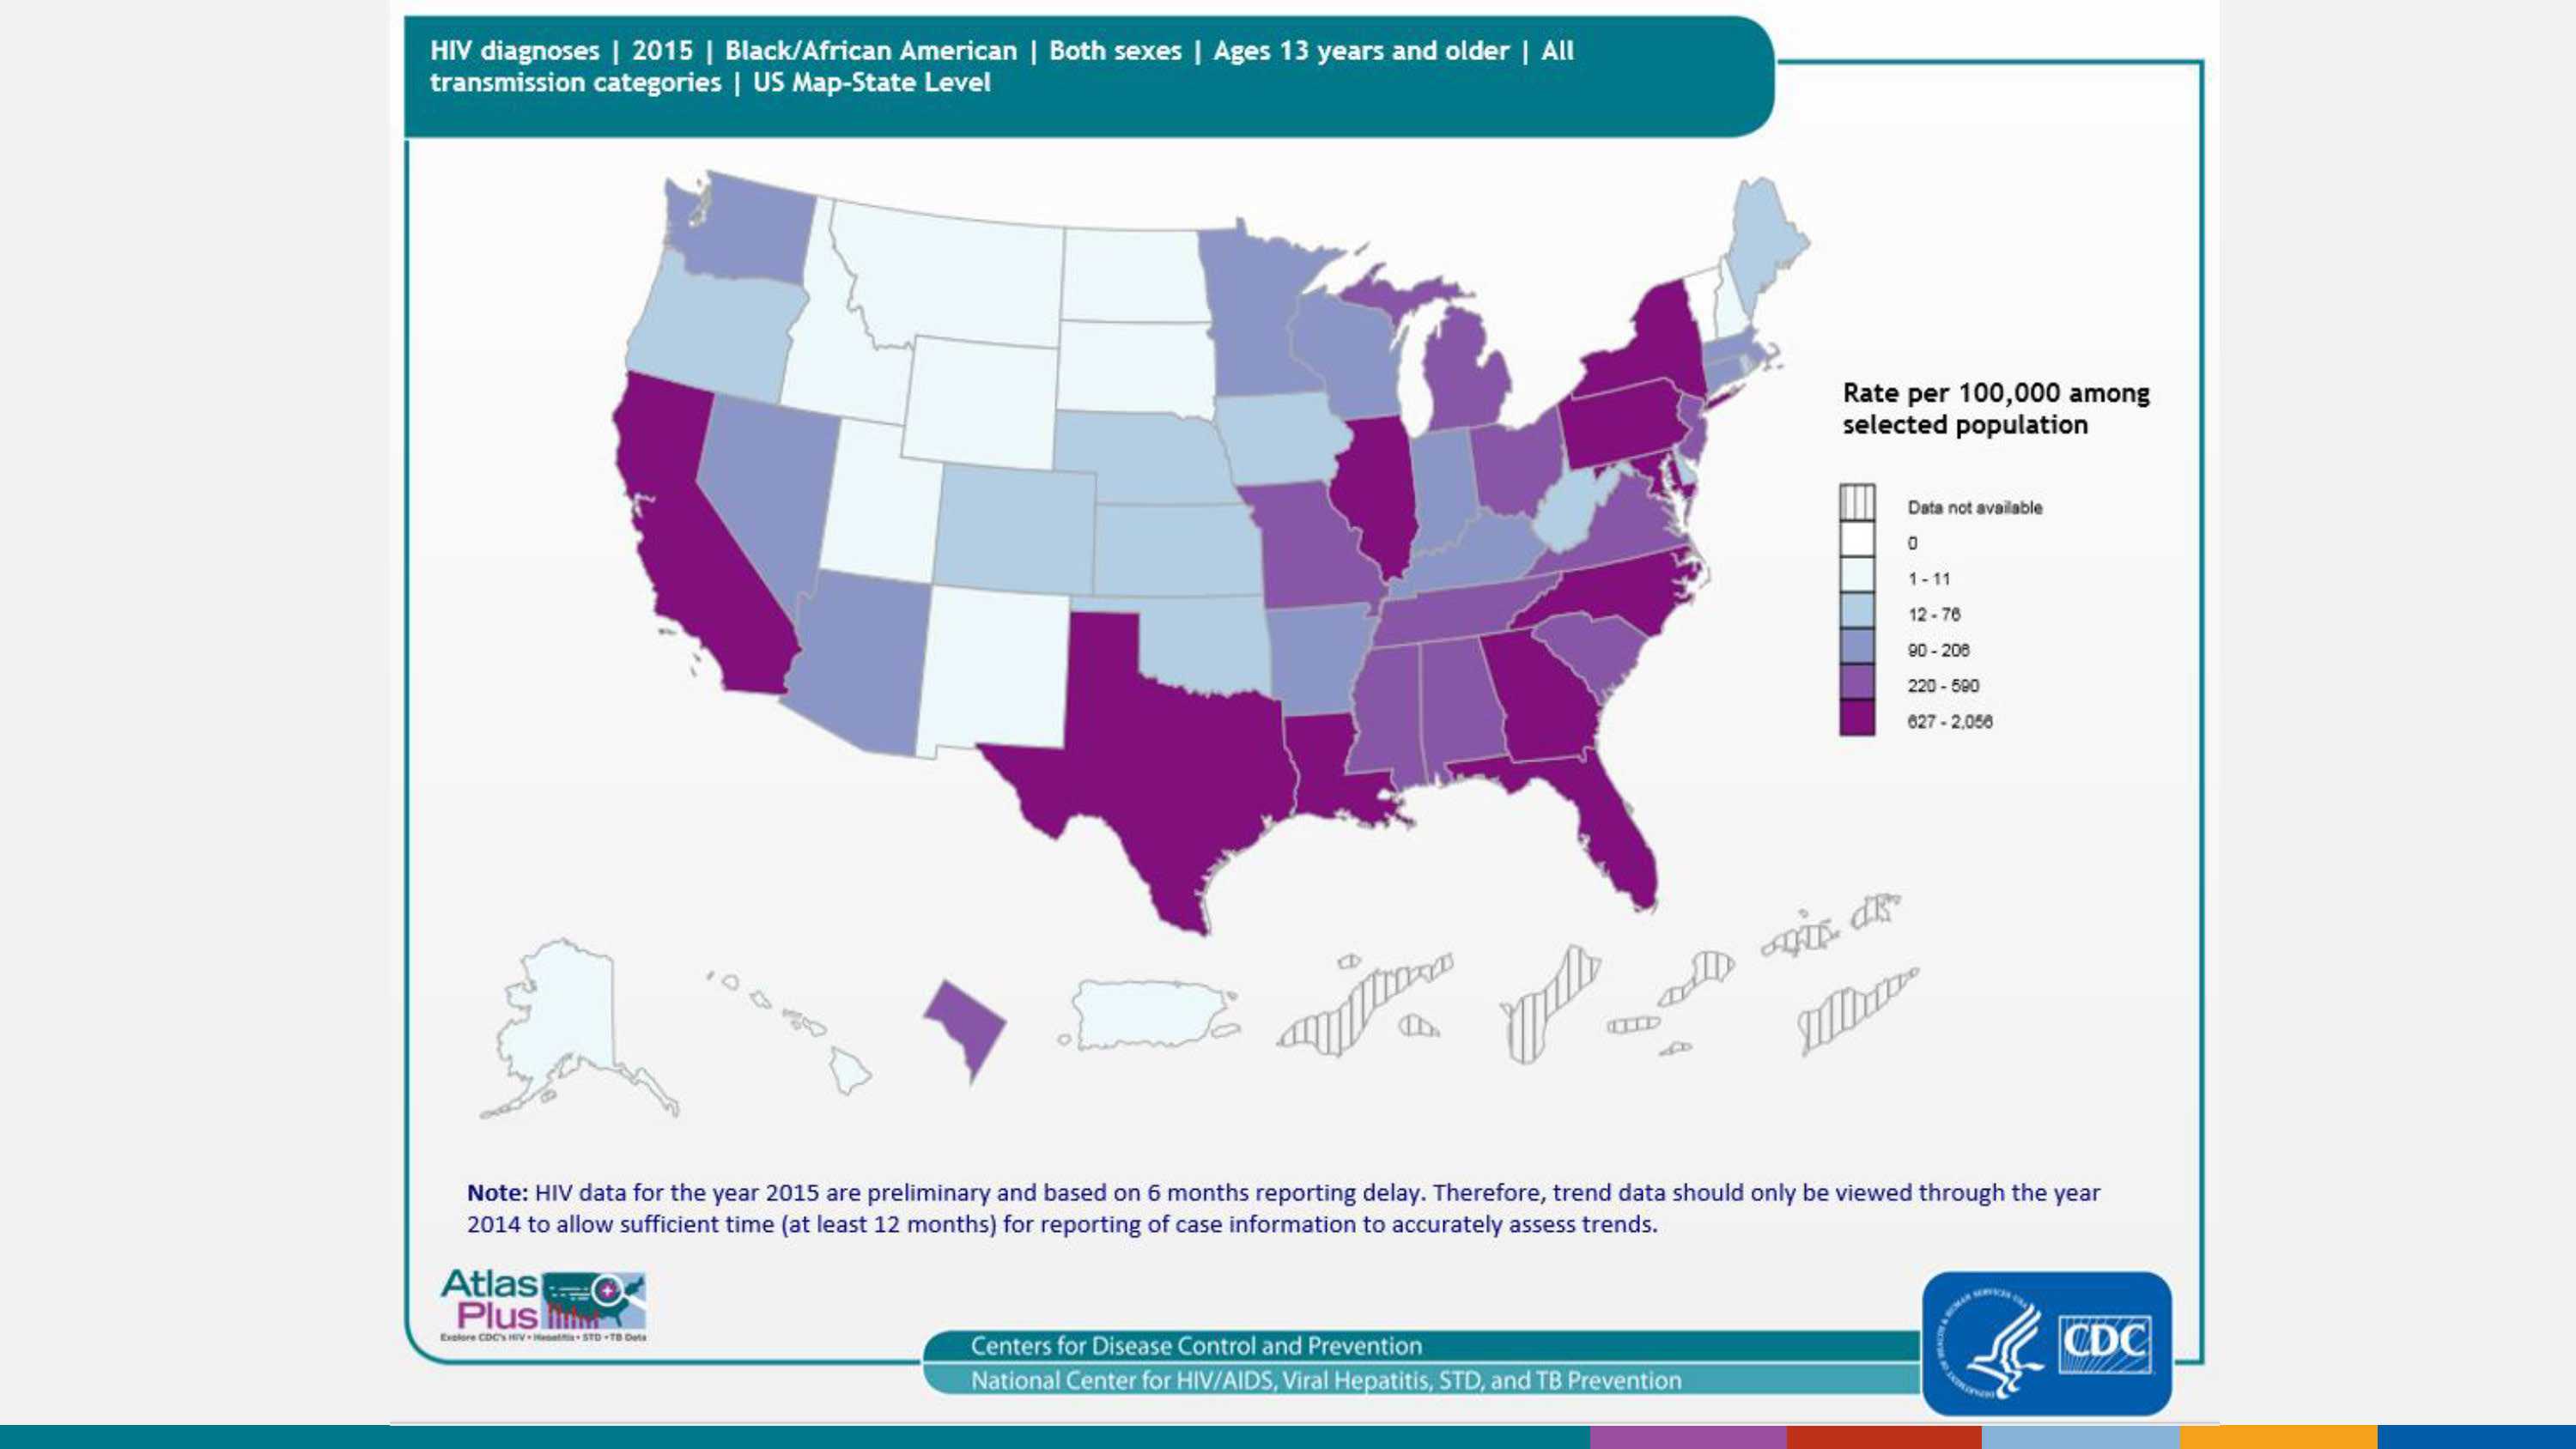
HIV diagnoses among blacks/African Americans, 2015 — United States and Puerto Rico, by state
In 2015, black/African American adults and adolescents made up approximately 12% of the population of the United States but accounted for 45% of diagnoses of HIV infection. As seen in the map, the highest rates were in the southern and northeastern regions of the United States.
For more information: https://www.cdc.gov/hiv/library/reports/surveillance/index.html
Slide 6
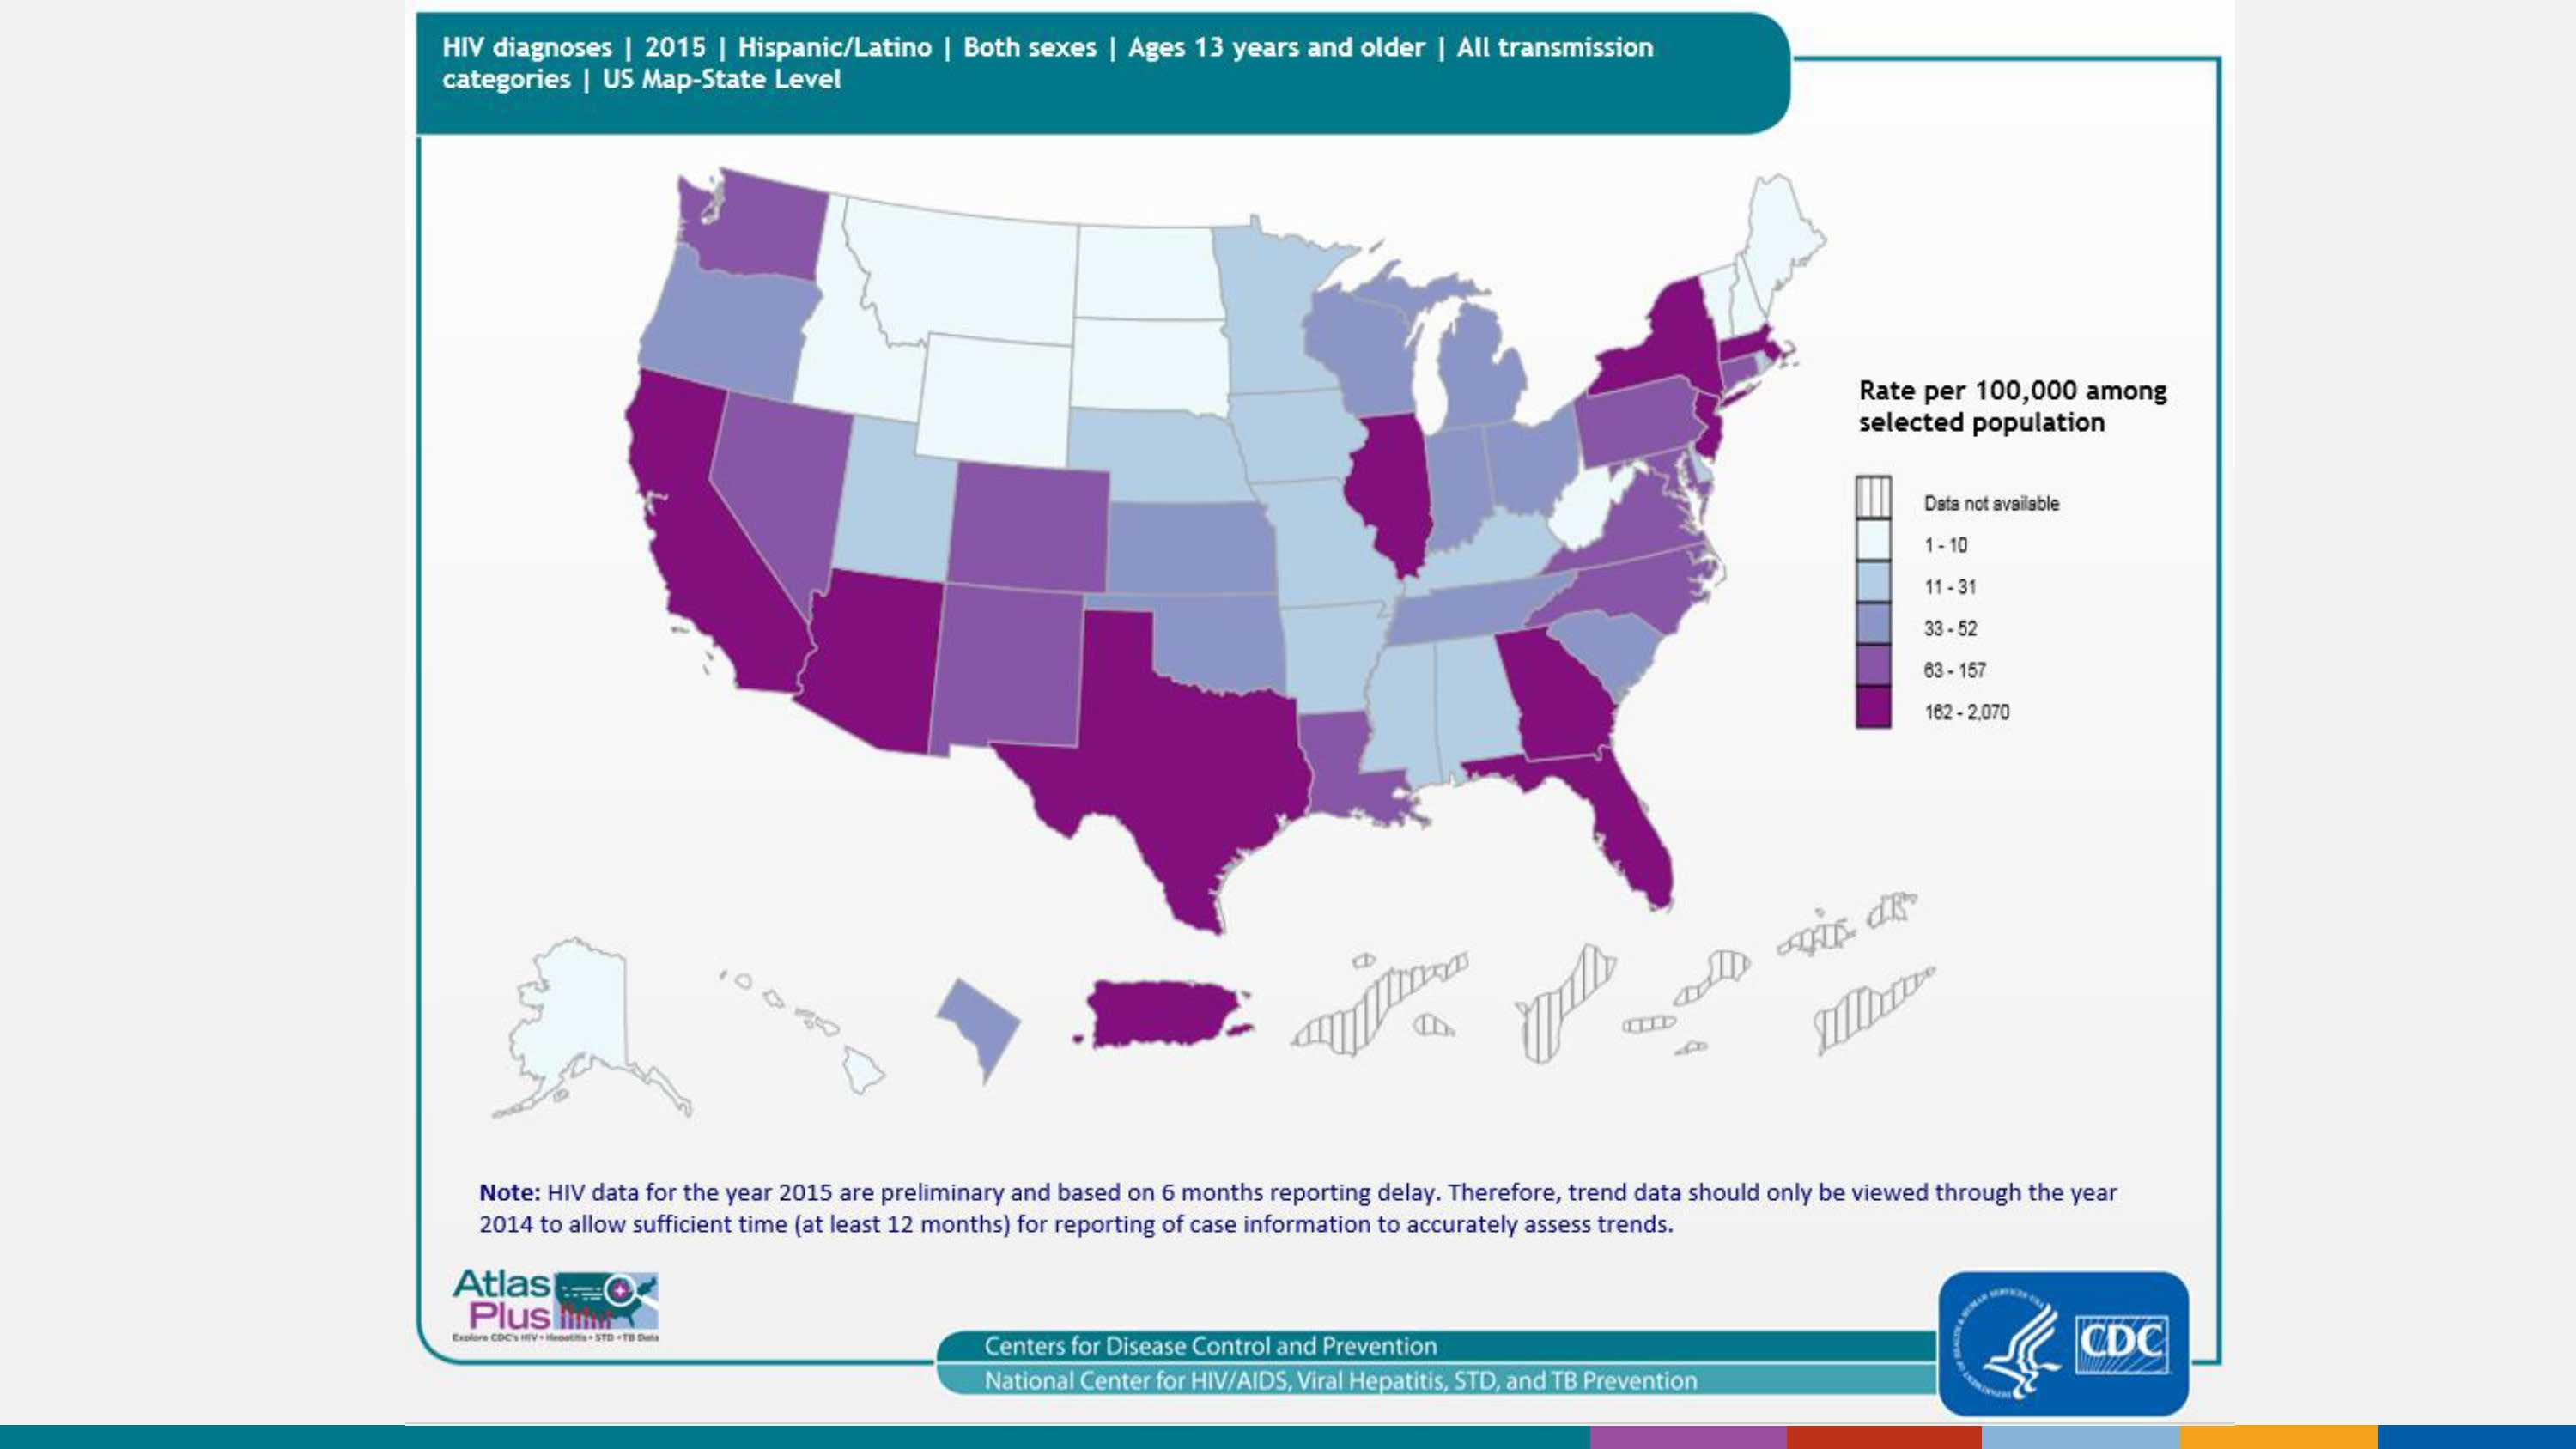
HIV diagnoses among Hispanics/Latinos, 2015 — United States and Puerto Rico, by state
In 2015, Hispanic/Latino adults and adolescents made up 17% of the population of the United States but accounted for 24% of diagnoses of HIV infection. As seen in the map, the highest rates were in the southern and northeastern regions of the United States and in Puerto Rico.
For more information: https://www.cdc.gov/hiv/library/reports/surveillance/index.html
Slide 7
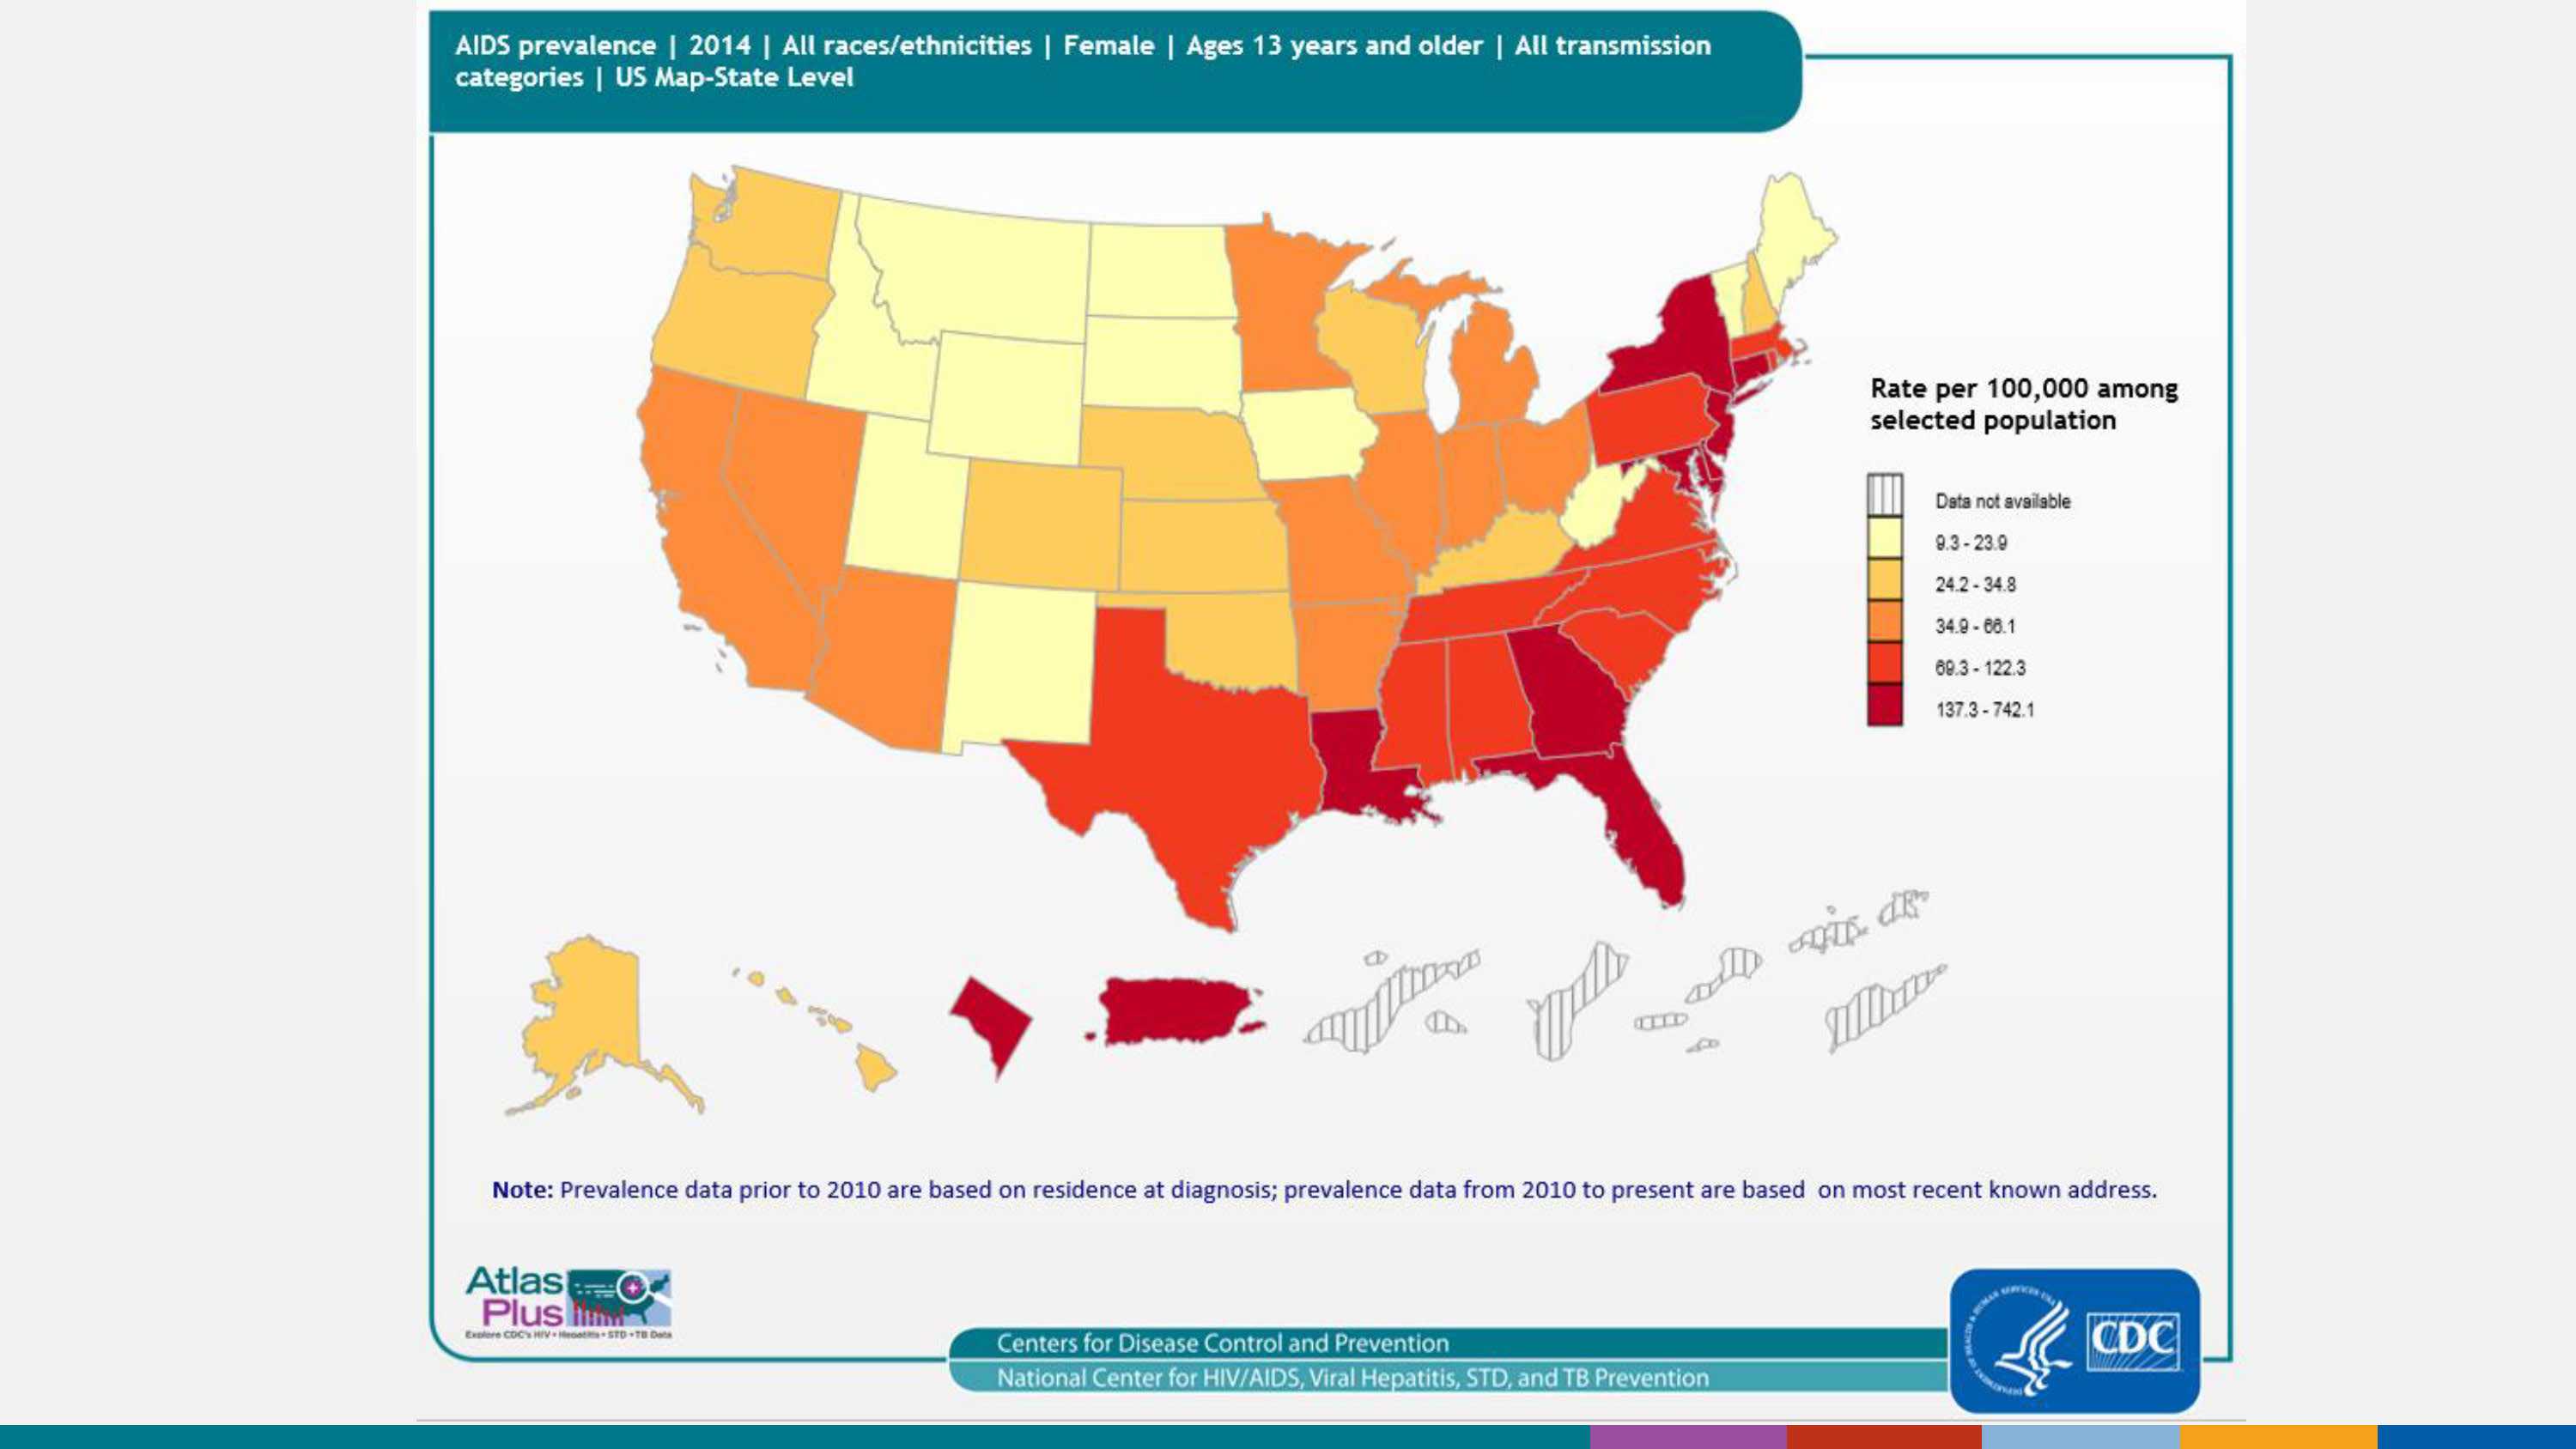
AIDS prevalence among females, year-end 2014 — United States and 5 dependent areas, by state
At the end of 2014, adult and adolescent females represented approximately 24% of the adults and adolescents living with HIV infection ever classified as stage 3 (AIDS) in the United States. As seen in the map, the highest rates are in the southern and northeastern regions of the United States and Puerto Rico.
For more information: https://www.cdc.gov/hiv/library/reports/surveillance/index.html
Slide 8
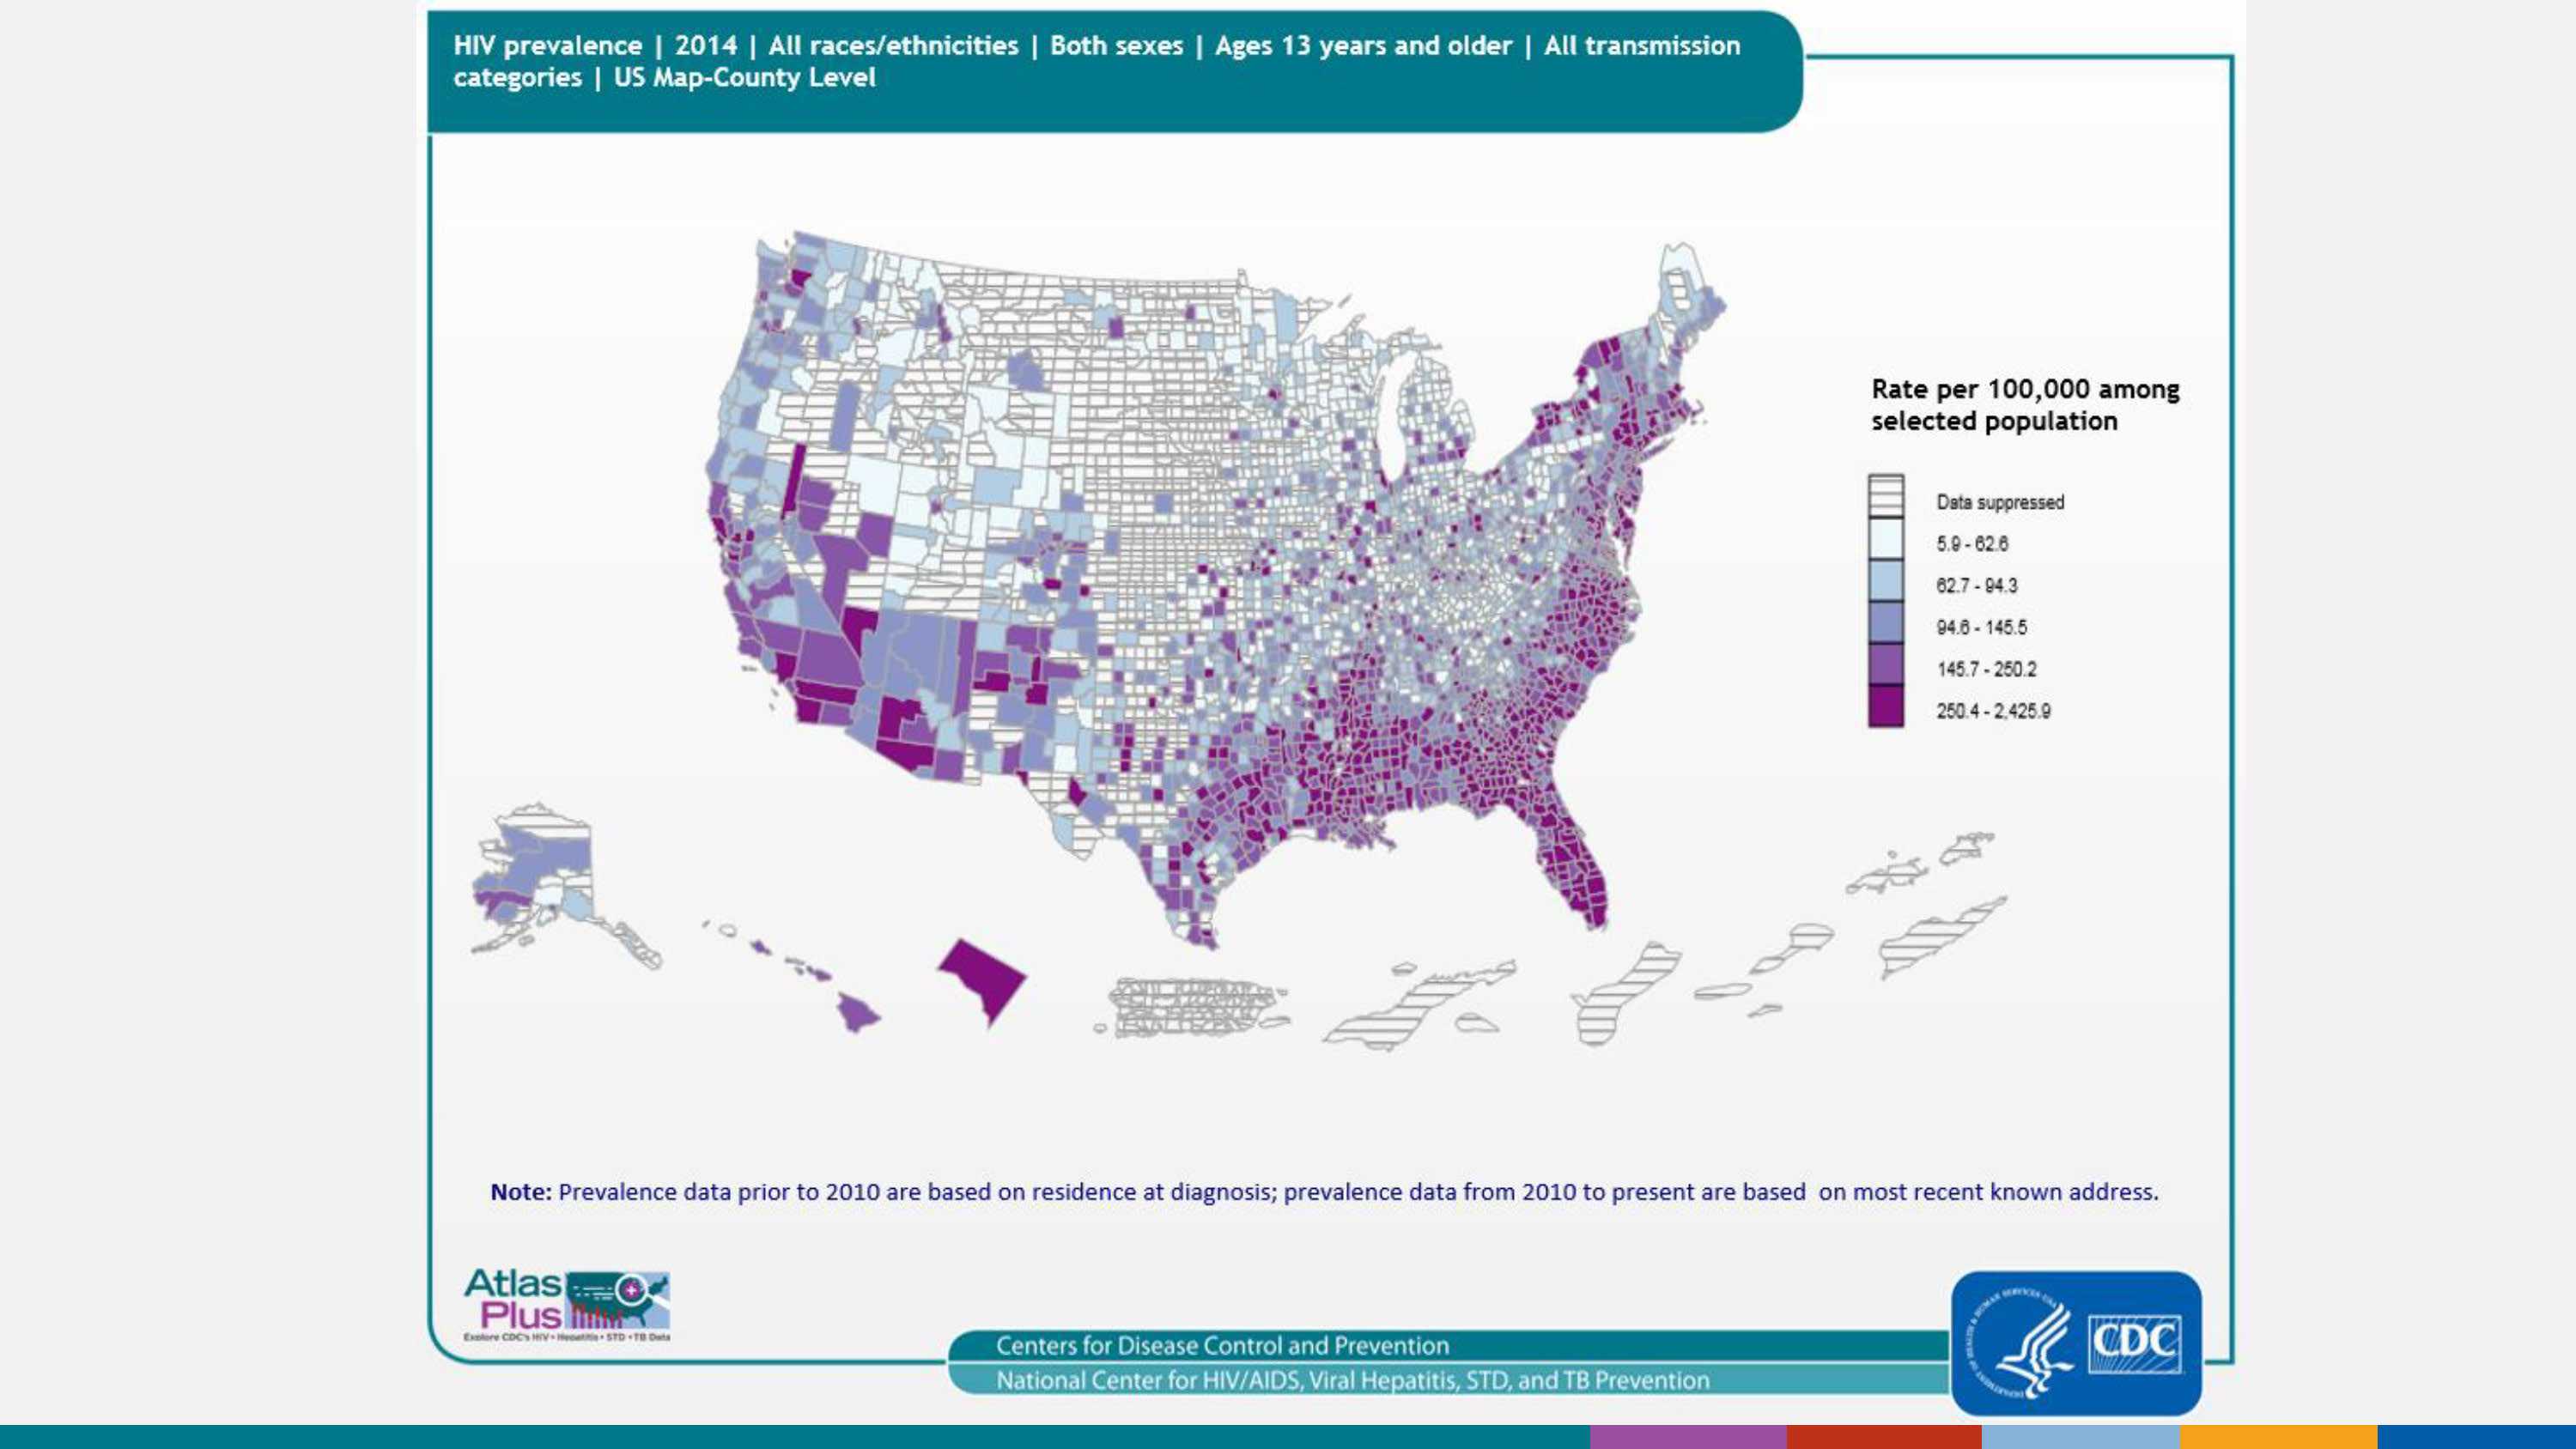
HIV prevalence, year-end 2014 — United States, by county
At the end of 2014, an estimated 952,604 adults and adolescents in the United States were living with diagnosed HIV infection. County-level data can illustrate patterns of persons living with HIV infection within states, as well as cross-state patterns and networks affecting public health. As seen in the map, the highest rates are in California, and the southern and northeastern regions of the United States.
For more information: https://www.cdc.gov/hiv/library/reports/surveillance/index.html
Slide 9
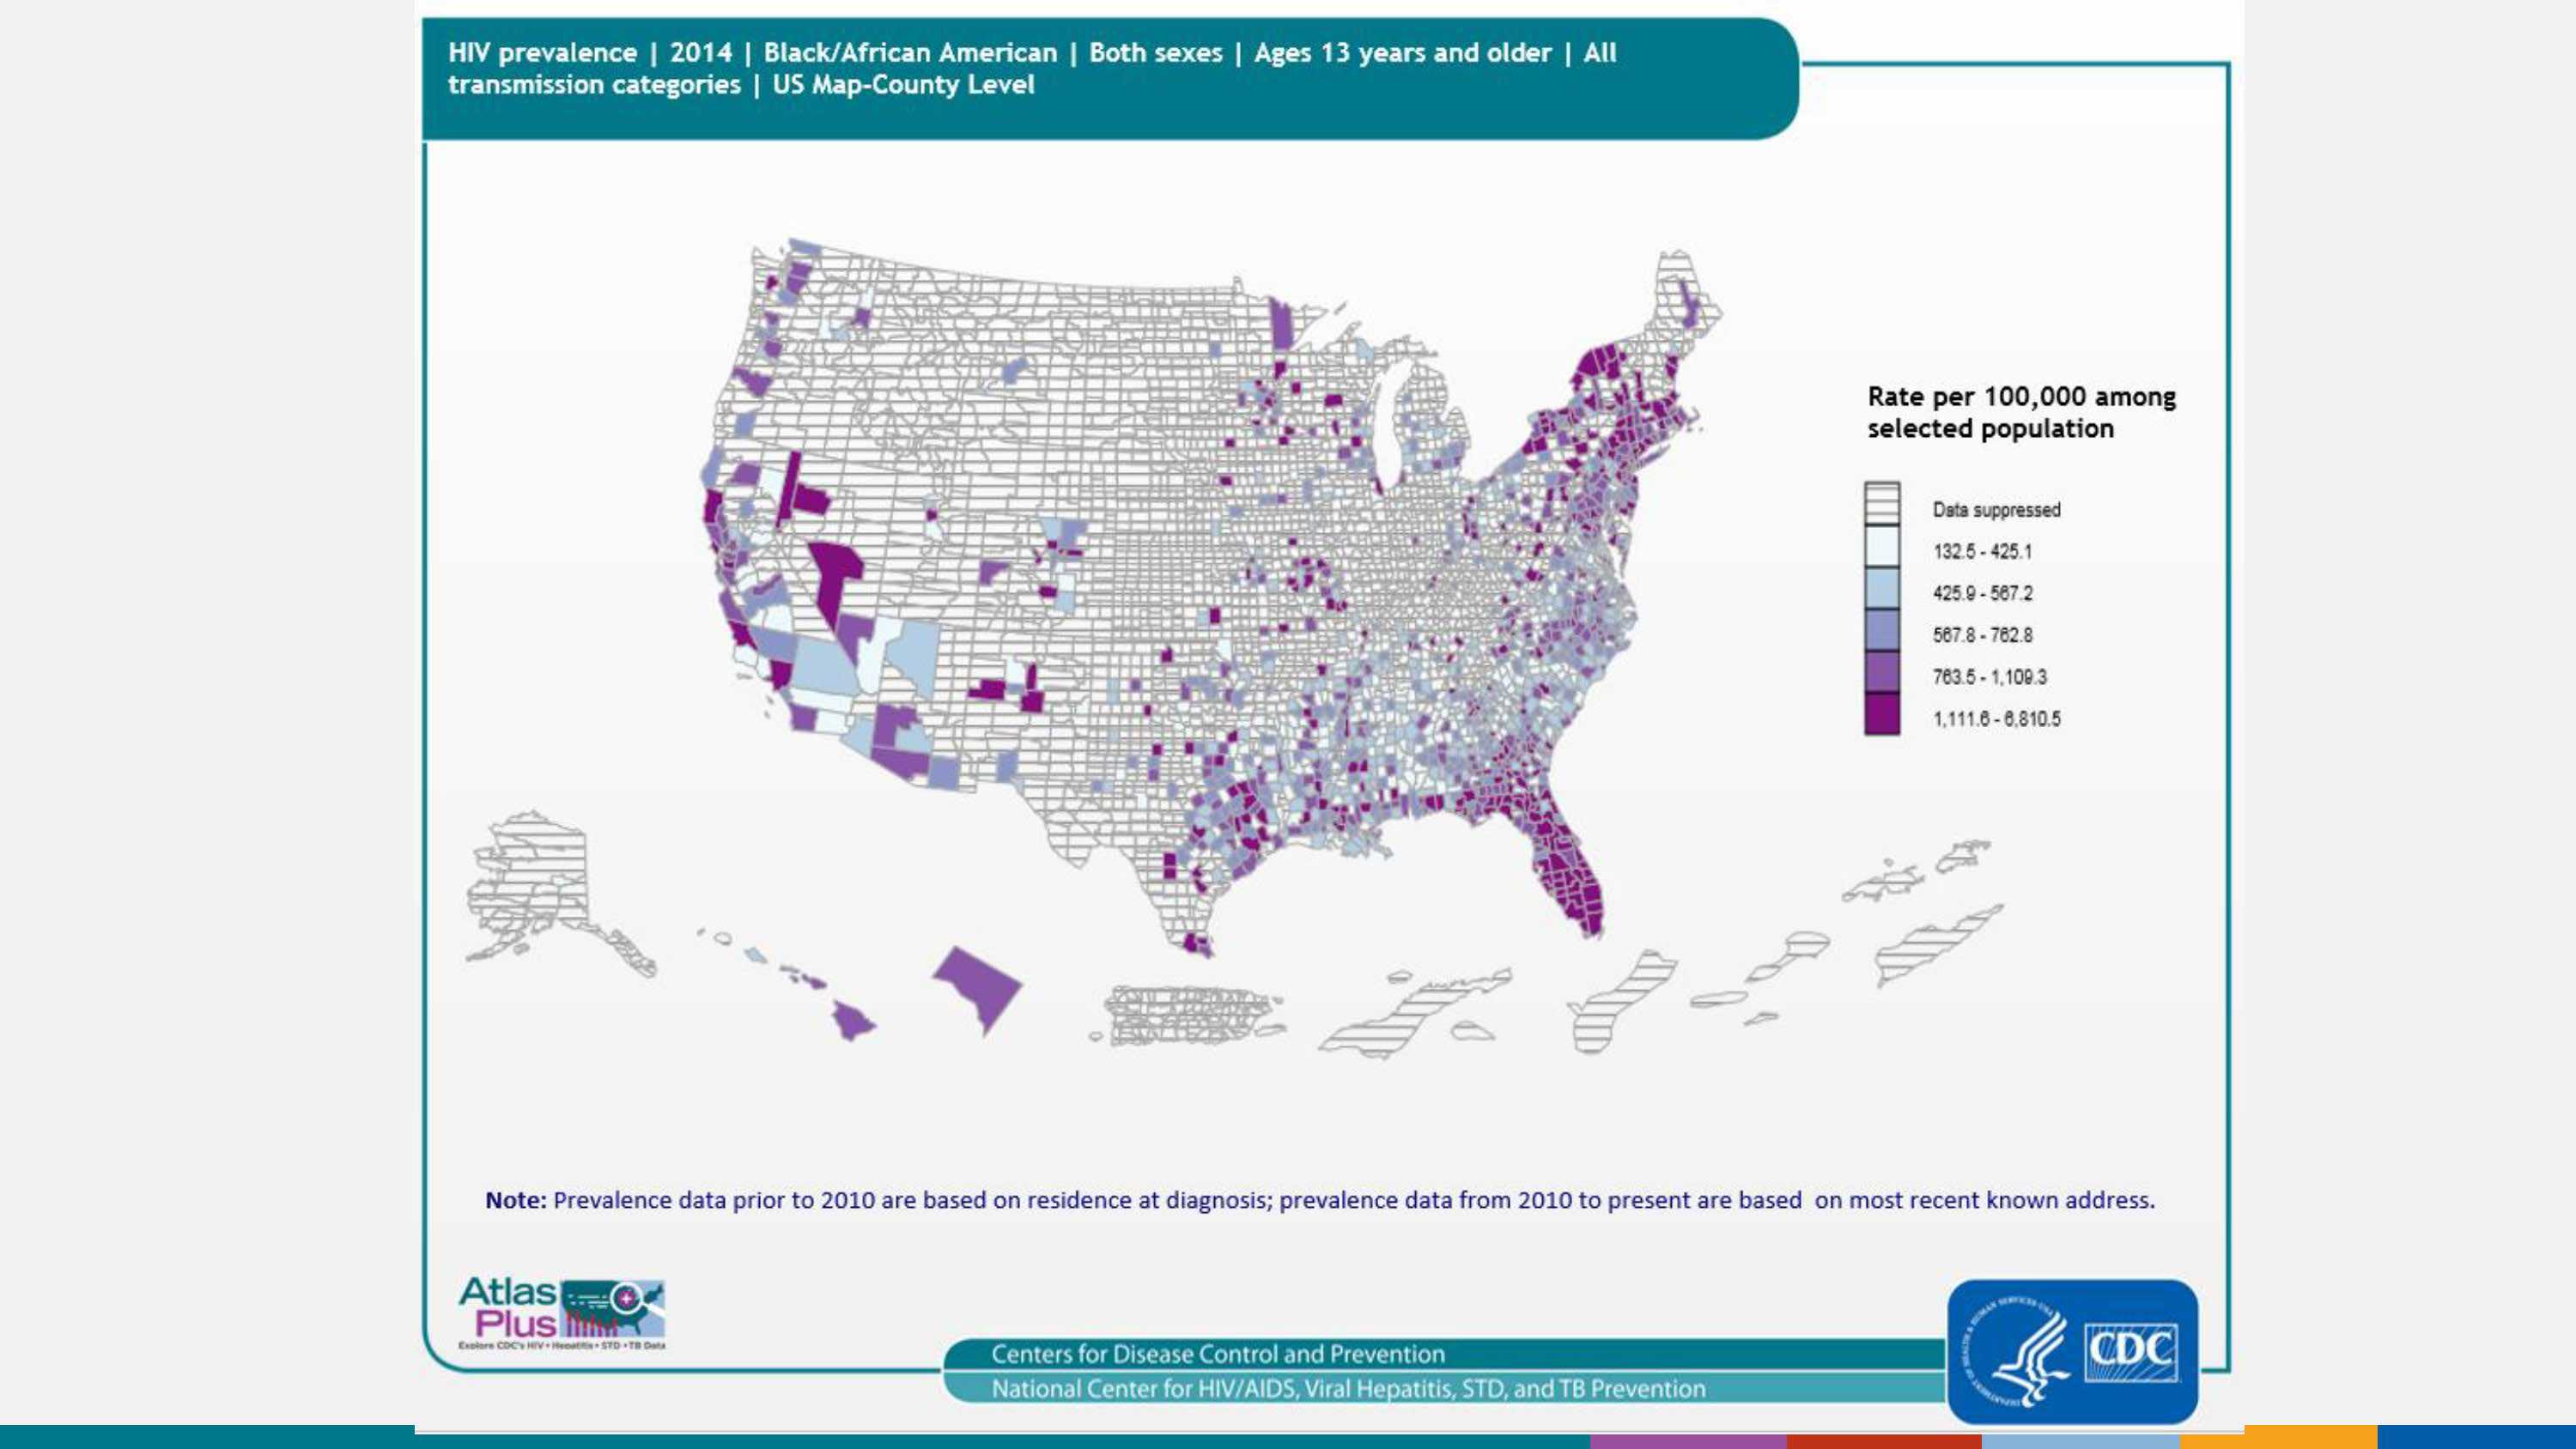
HIV prevalence among Blacks/African Americans, year-end 2014 — United States, by county
At the end of 2014, the highest rate (1,249.1 per 100,000) and the largest percentage (42%) of HIV prevalence were those among black/African American adults and adolescents. County-level data can illustrate patterns of persons living with HIV infection within states, as well as cross-state patterns and networks affecting public health. As seen in the map, the highest rates are in California, and the southern and northeastern regions of the United States.
For more information: https://www.cdc.gov/hiv/library/reports/surveillance/index.html
Slide 10
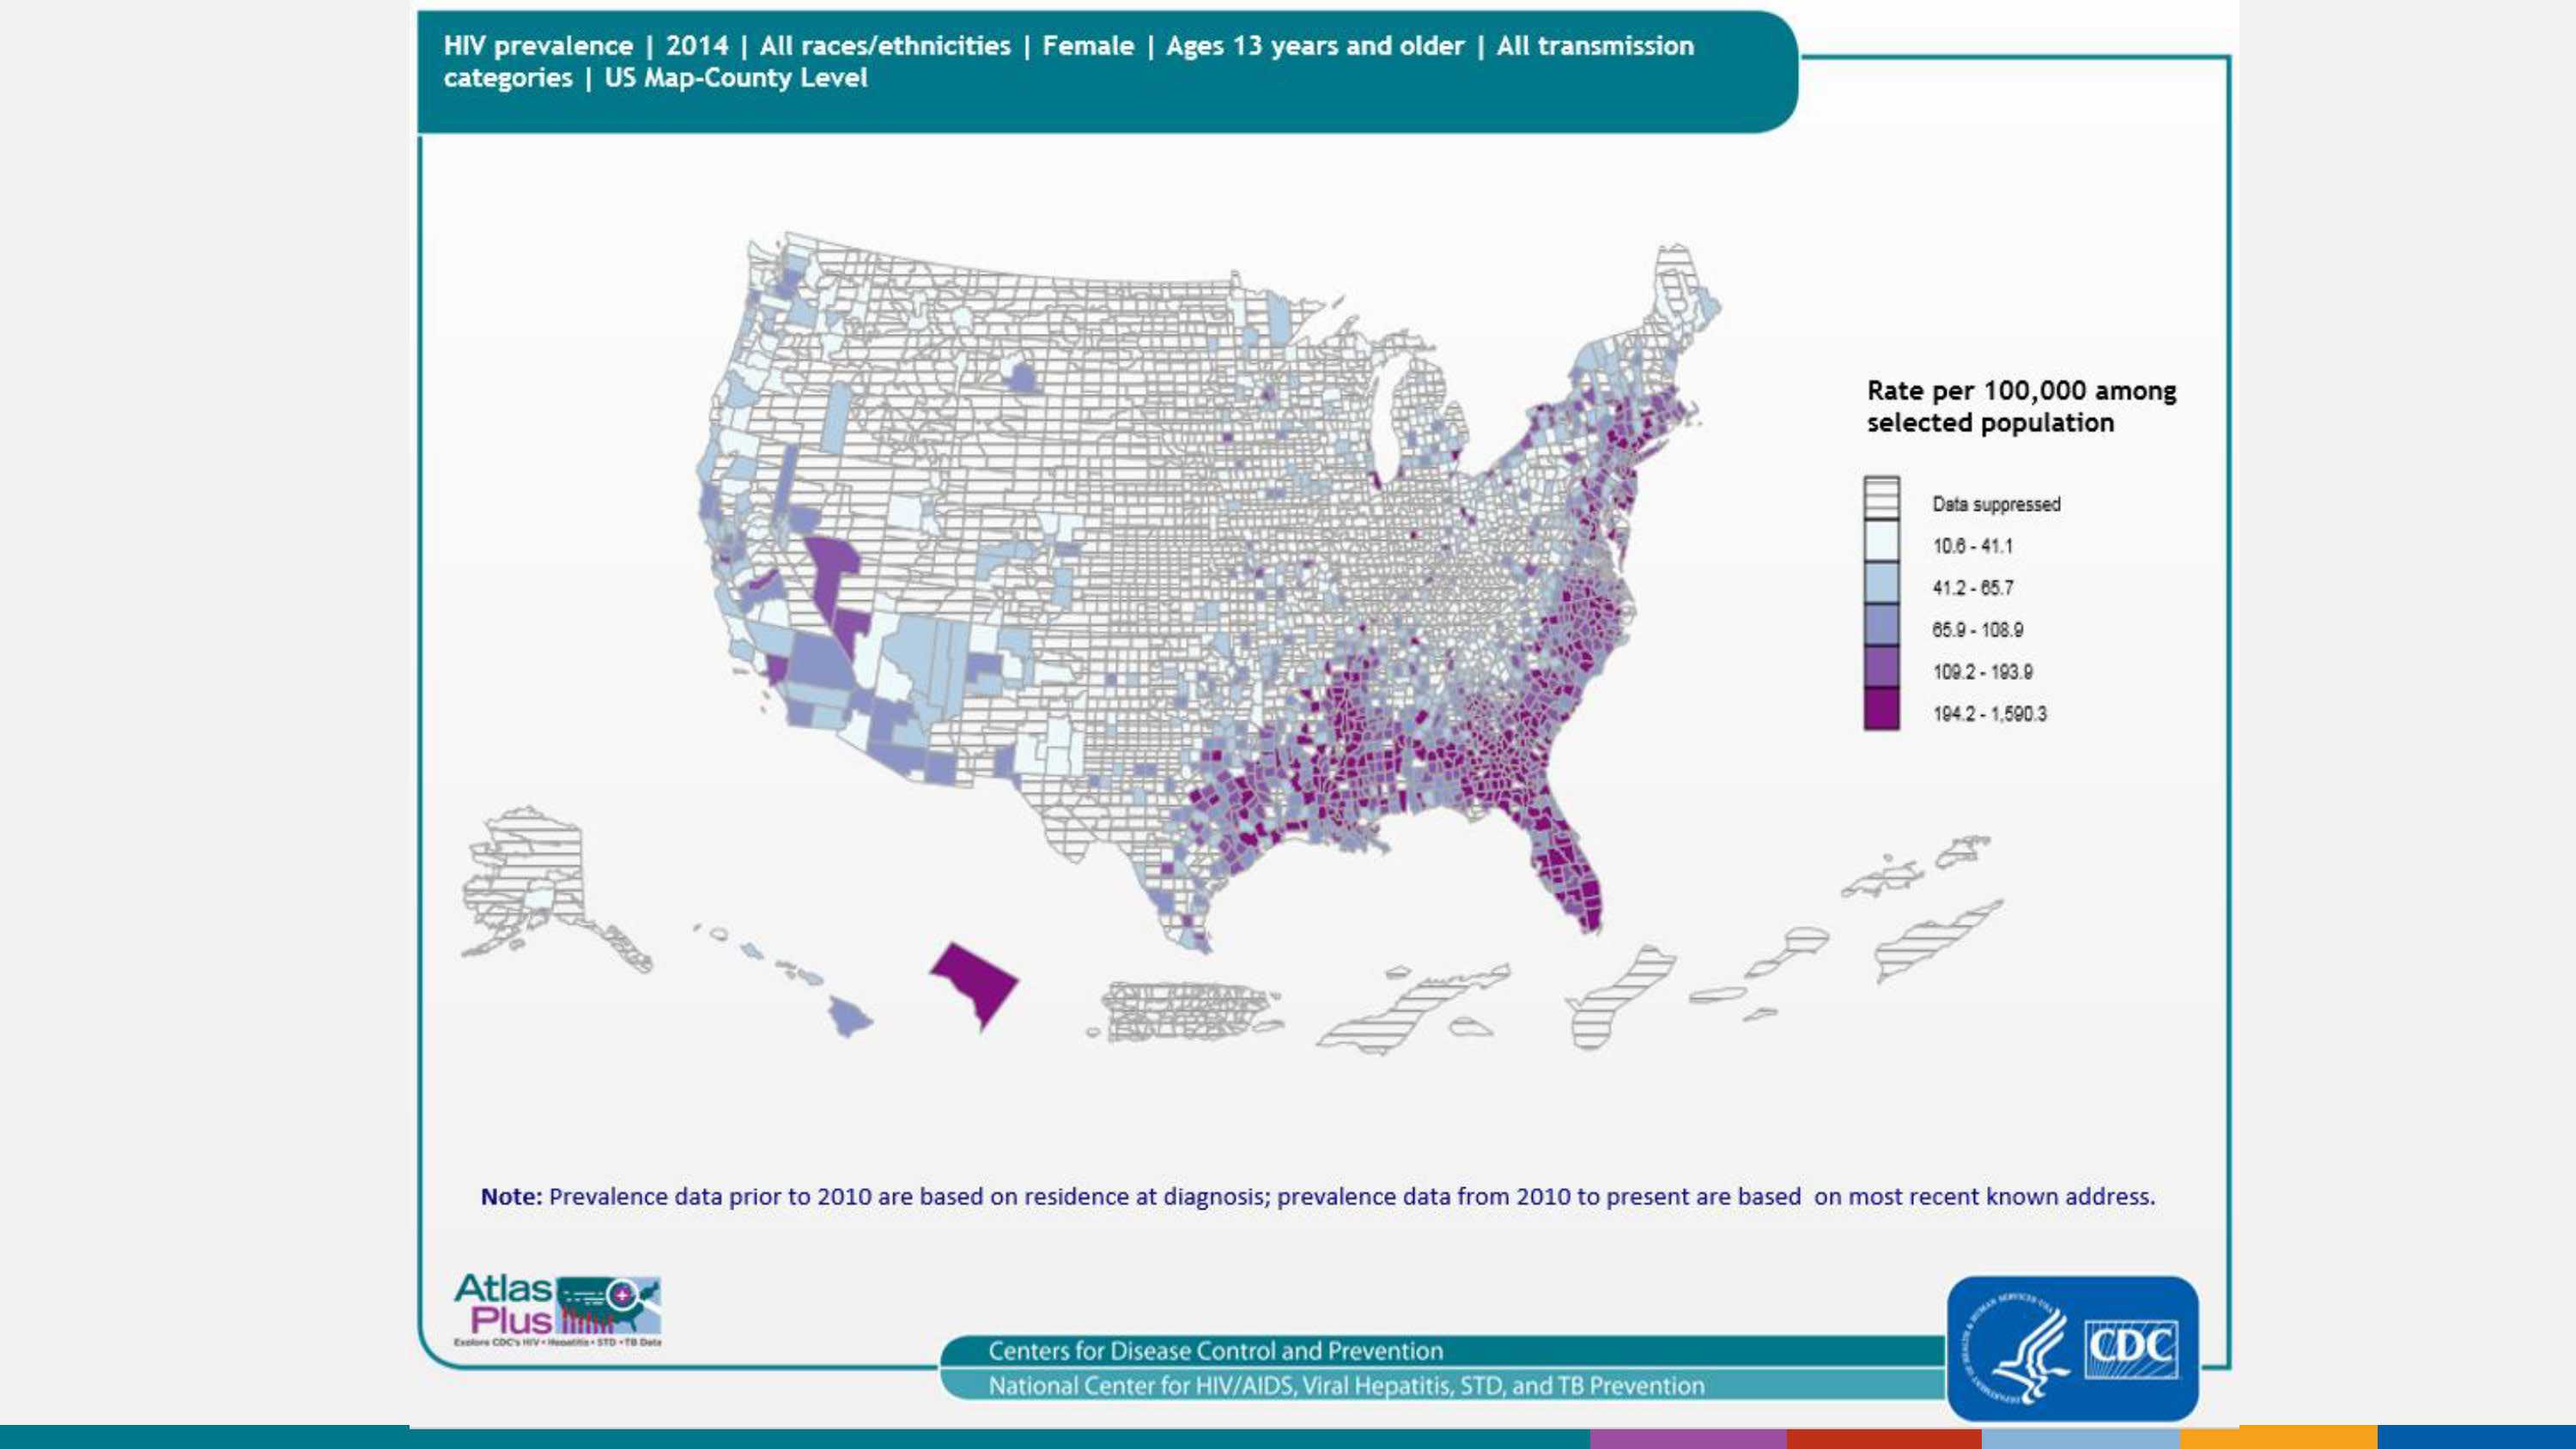
HIV prevalence among females, year-end 2014 — United States, by county
At the end of 2014, the estimated rate was 167.7 per 100,000 adult and adolescent females. County-level data can illustrate patterns of persons living with HIV infection within states, as well as cross-state patterns and networks affecting public health. As seen in the map, the highest rates are in southeastern and northeastern regions of the United States.
For more information: https://www.cdc.gov/hiv/library/reports/surveillance/index.html
Slide 11
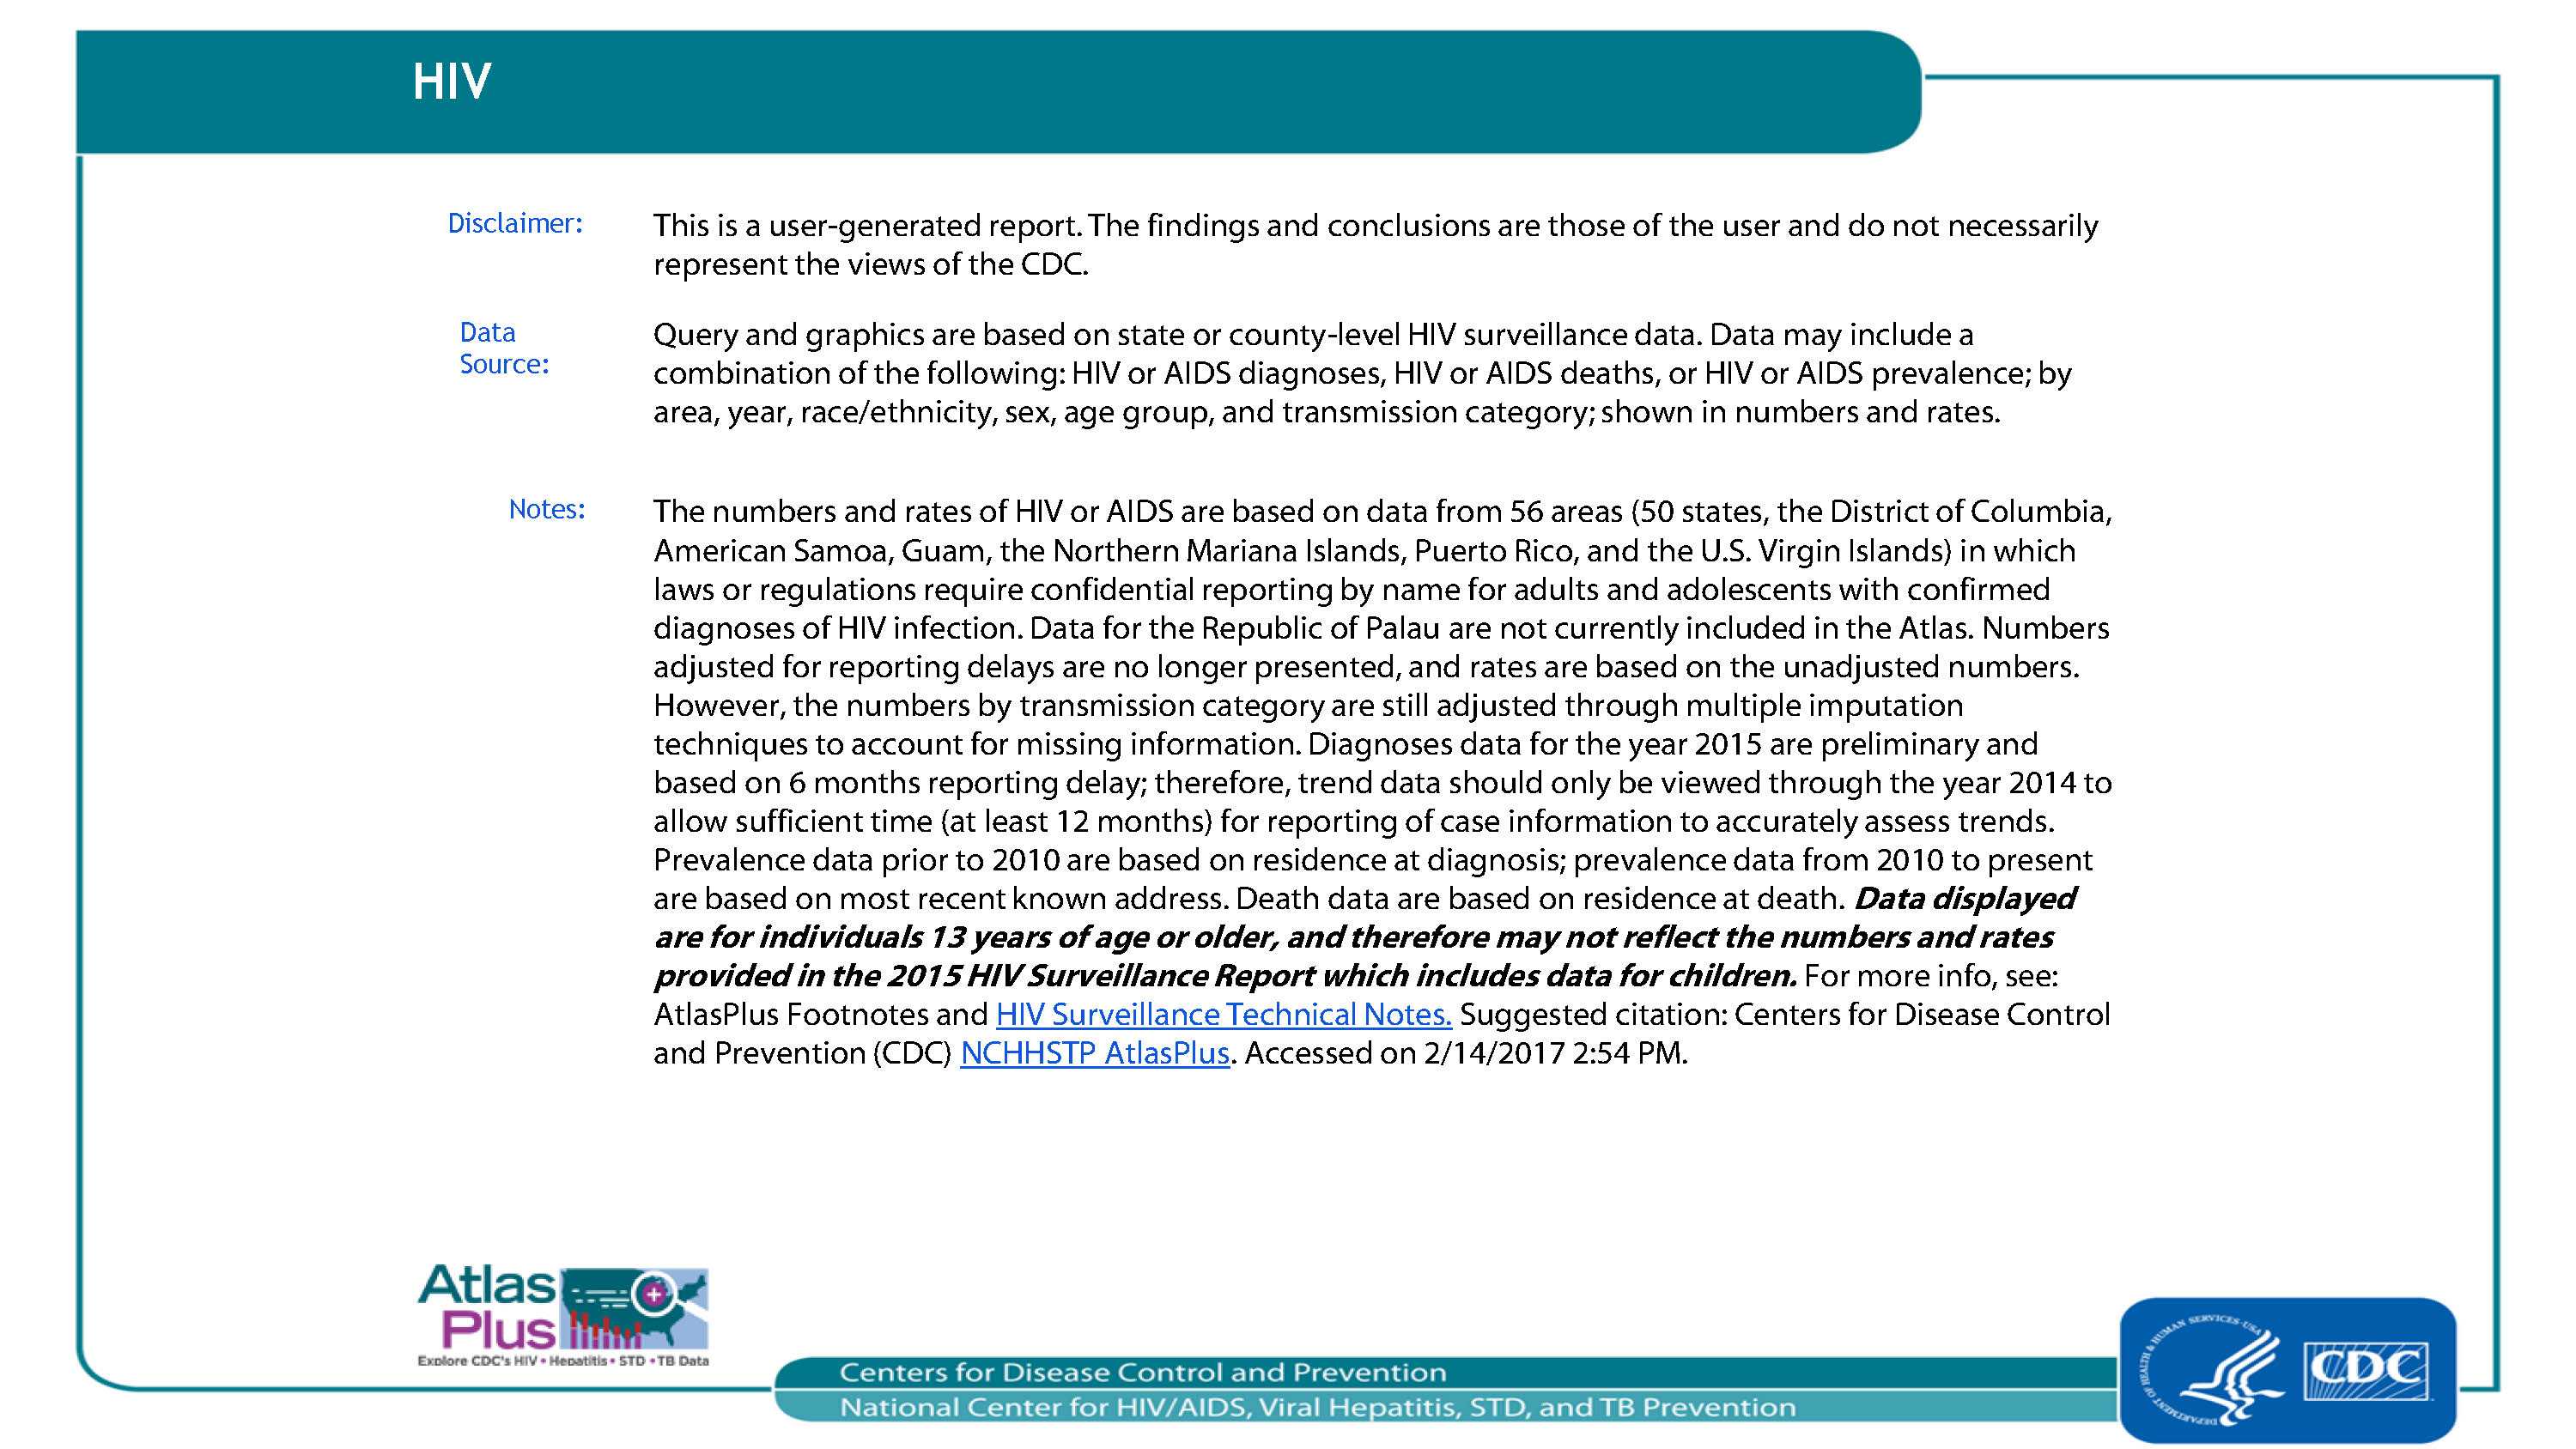
Disclaimer: This is a user-generated report. The findings and conclusions are those of the user and do not necessarily represent the views of the CDC.
Query and graphics are based on state or county-level HIV surveillance data. Data may include a combination of the following: HIV or AIDS diagnoses, HIV or AIDS deaths, or HIV or AIDS prevalence; by area, year, race/ethnicity, sex, age group, and transmission category; shown in numbers and rates. The numbers and rates of HIV or AIDS are based on data from 56 areas (50 states, the District of Columbia, American Samoa, Guam, the Northern Mariana Islands, Puerto Rico, and the U.S. Virgin Islands) in which laws or regulations require confidential reporting by name for adults and adolescents with confirmed diagnoses of HIV infection. Data for the Republic of Palau are not currently included in the Atlas. Numbers adjusted for reporting delays are no longer presented, and rates are based on the unadjusted numbers. However, the numbers by transmission category are still adjusted through multiple imputation techniques to account for missing information. Diagnoses data for the year 2015 are preliminary and based on 6 months reporting delay; therefore, trend data should only be viewed through the year 2014 to allow sufficient time (at least 12 months) for reporting of case information to accurately assess trends. Prevalence data prior to 2010 are based on residence at diagnosis; prevalence data from 2010 to present are based on most recent known address. Death data are based on residence at death. Data displayed are for individuals 13 years of age or older, and therefore may not reflect the numbers and rates provided in the 2015 HIV Surveillance Report which includes data for children.
For more info, see: AtlasPlus Footnotes and HIV Surveillance Technical Notes. Suggested citation: Centers for Disease Control and Prevention (CDC) NCHHSTP AtlasPlus. Accessed on {date}.
Slide 12
To learn more about the diseases:
- HIV
- Chlamydia, Gonorrhea, Syphilis
- Acute Viral Hepatitis A, Acute Viral Hepatitis B, and Acute Viral Hepatitis C
- Tuberculosis (TB)
For data sources:
- Page last reviewed: April 10, 2017
- Page last updated: April 10, 2017
- Content source: