

Viral Hepatitis Recommended Queries
 ShareCompartir
Download Hep slideset: pdf version | PowerPoint version
Slide 1
Division of Viral Hepatitis scientific staff were asked to highlight some of the most important Acute Viral Hepatitis data. In this notes area of the powerpoint, each slide contains the title (with the variables selected), some contextual information, and links to additional data and information on the topic.
The acute viral hepatitis data are not available at the county level nor are they queryable by additional stratifications (e.g., race/ethnicity, age group, or sex), nor are the available for the 5 US territories.
In this notes area of the powerpoint, each slide contains the title (with the variables selected), some contextual information, and links to additional data and information on the topic. All of the NCHHSTP Atlas maps are choropleth maps, which use sequential colors (e.g., light blue to dark blue) to display data that progress from low to high values. Typically, one uses light colors for low data values and dark colors for high data values.
Slide 2
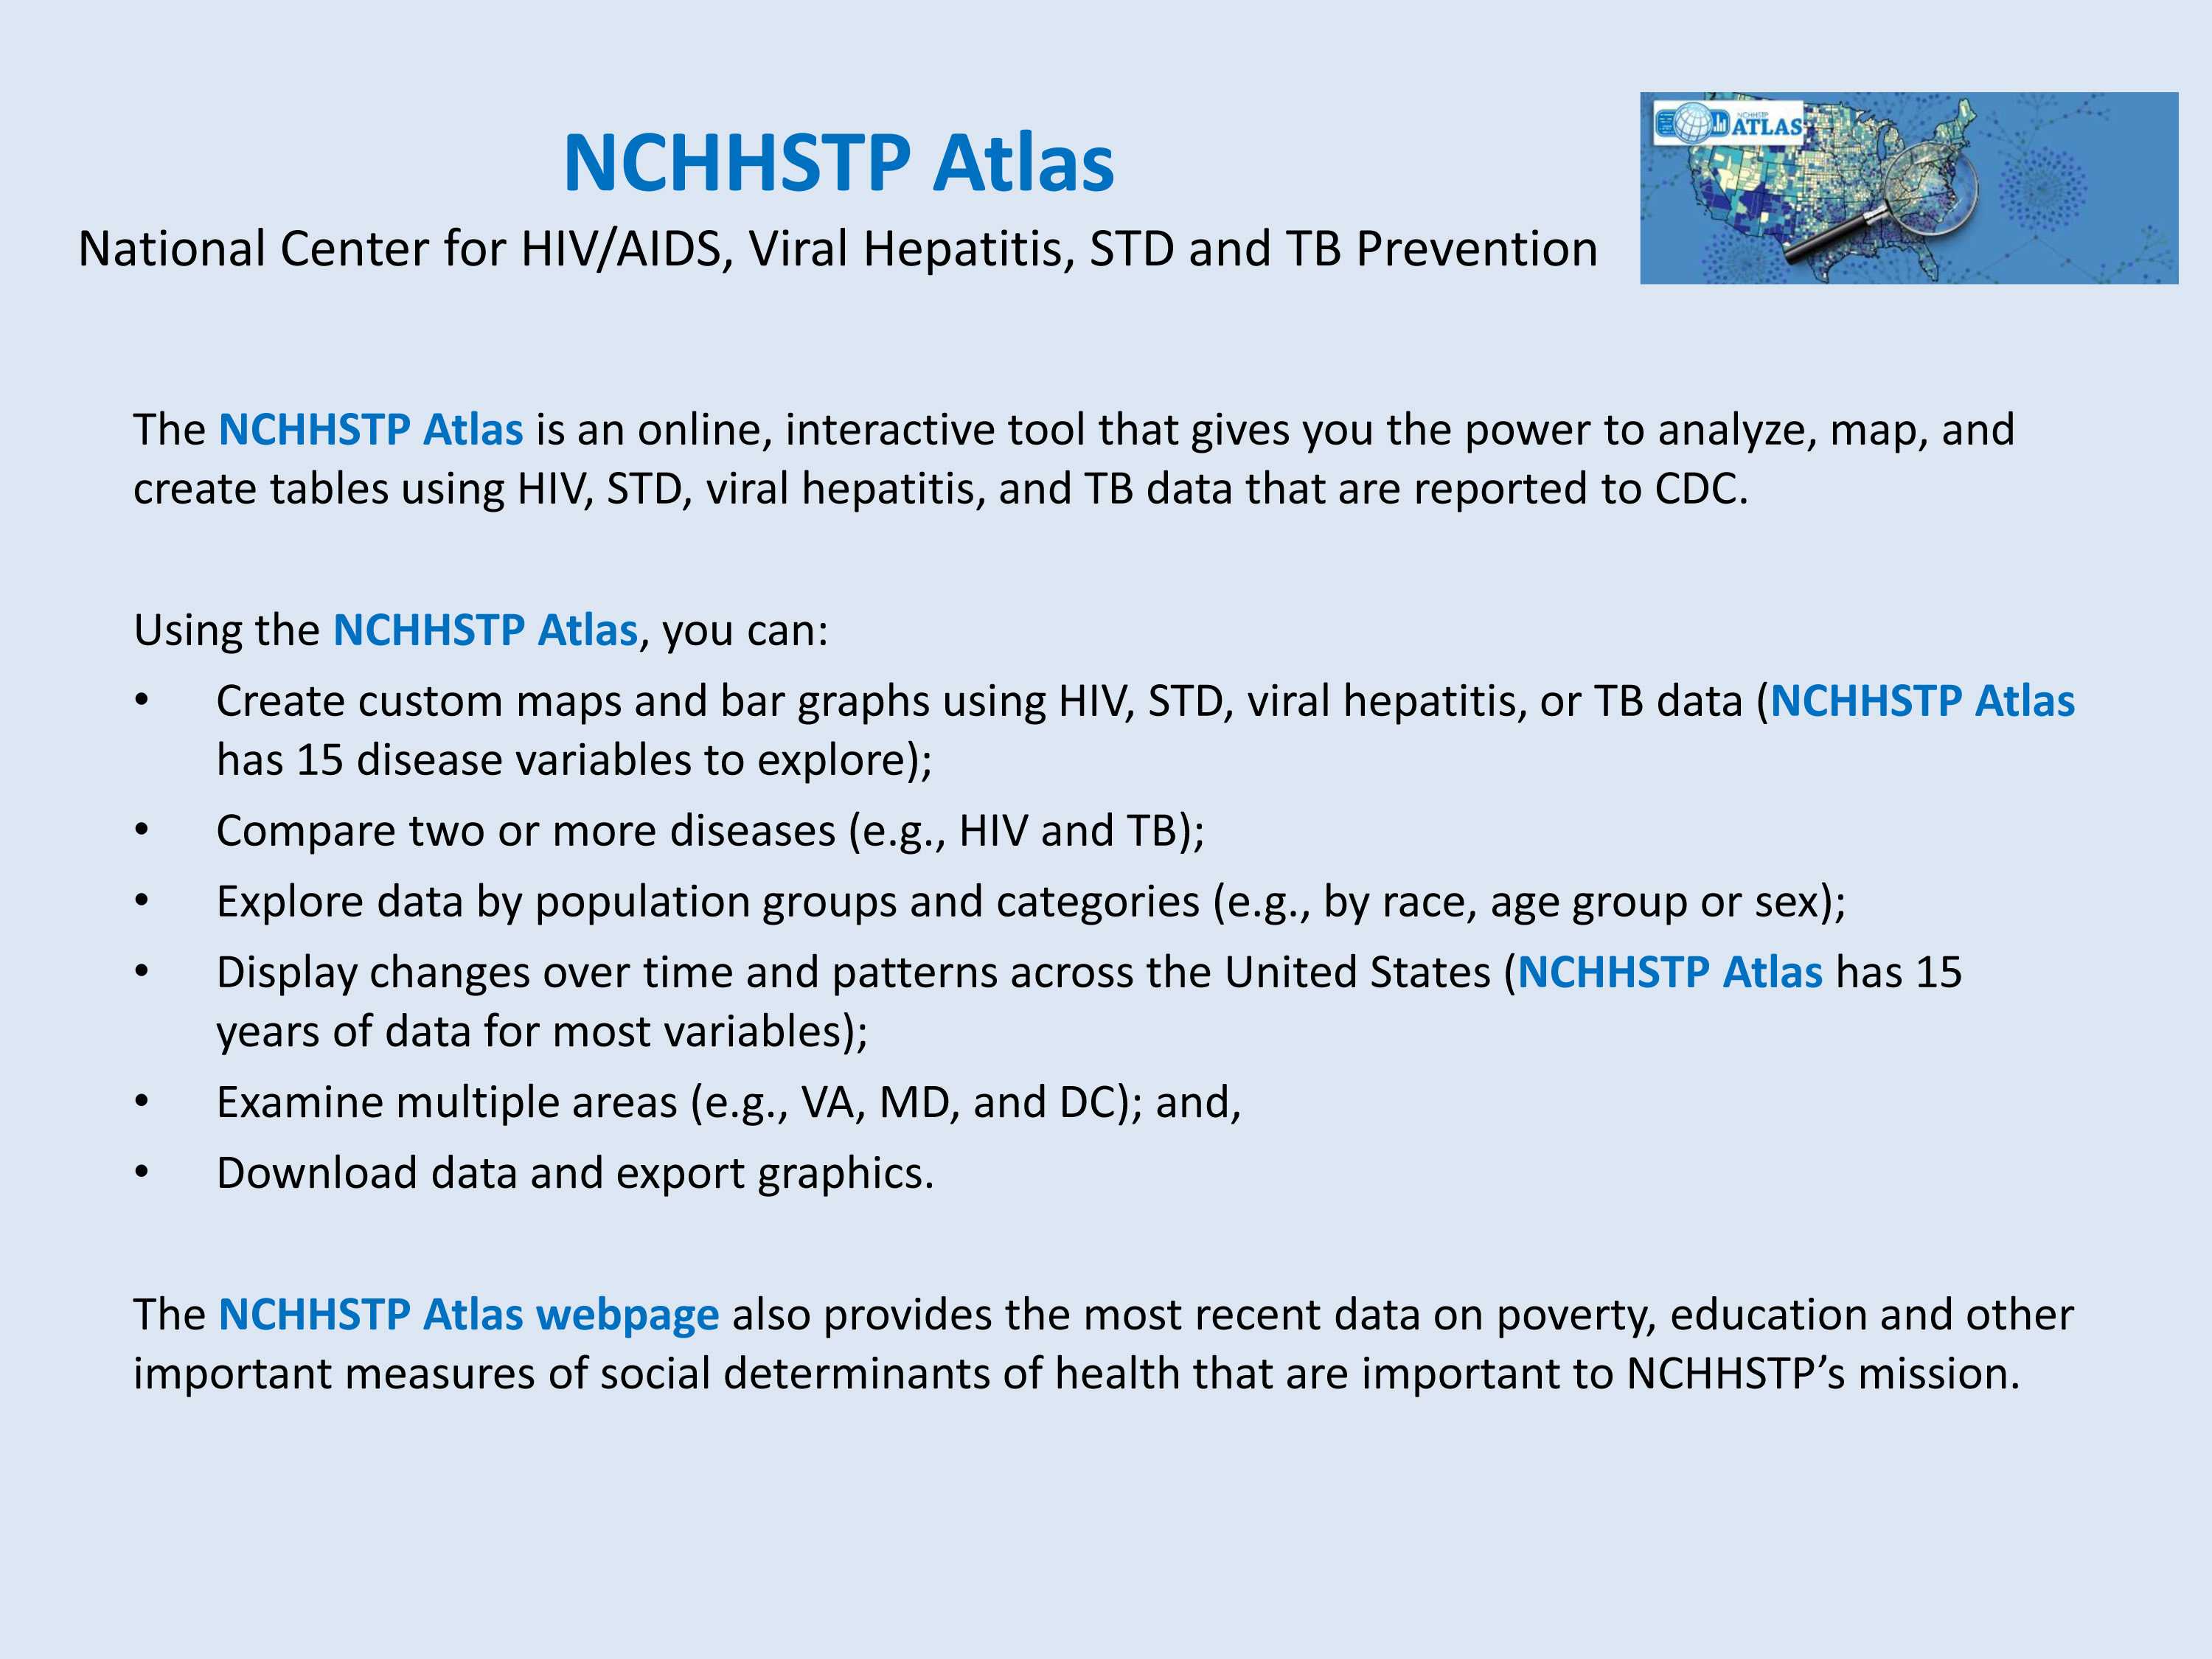
The NCHHSTP Atlas is an online, interactive tool that gives you the power to analyze, map, and create tables using HIV, STD, viral hepatitis, and TB data that are reported to CDC.
Using the NCHHSTP Atlas, you can:
- Create custom maps and bar graphs using HIV, STD, viral hepatitis, or TB data (NCHHSTP Atlas has 15 disease variables to explore);
- Compare two or more diseases (e.g., HIV and TB);
- Explore data by population groups and categories (e.g., by race, age group or sex);
- Display changes over time and patterns across the United States (NCHHSTP Atlas has 15 years of data for most variables);
- Examine multiple areas (e.g., VA, MD, and DC); and,
- Download data and export graphics.
The NCHHSTP Atlas webpage also provides the most recent data on poverty, education and other important measures of social determinants of health that are important to NCHHSTP’s mission.
Slide 3
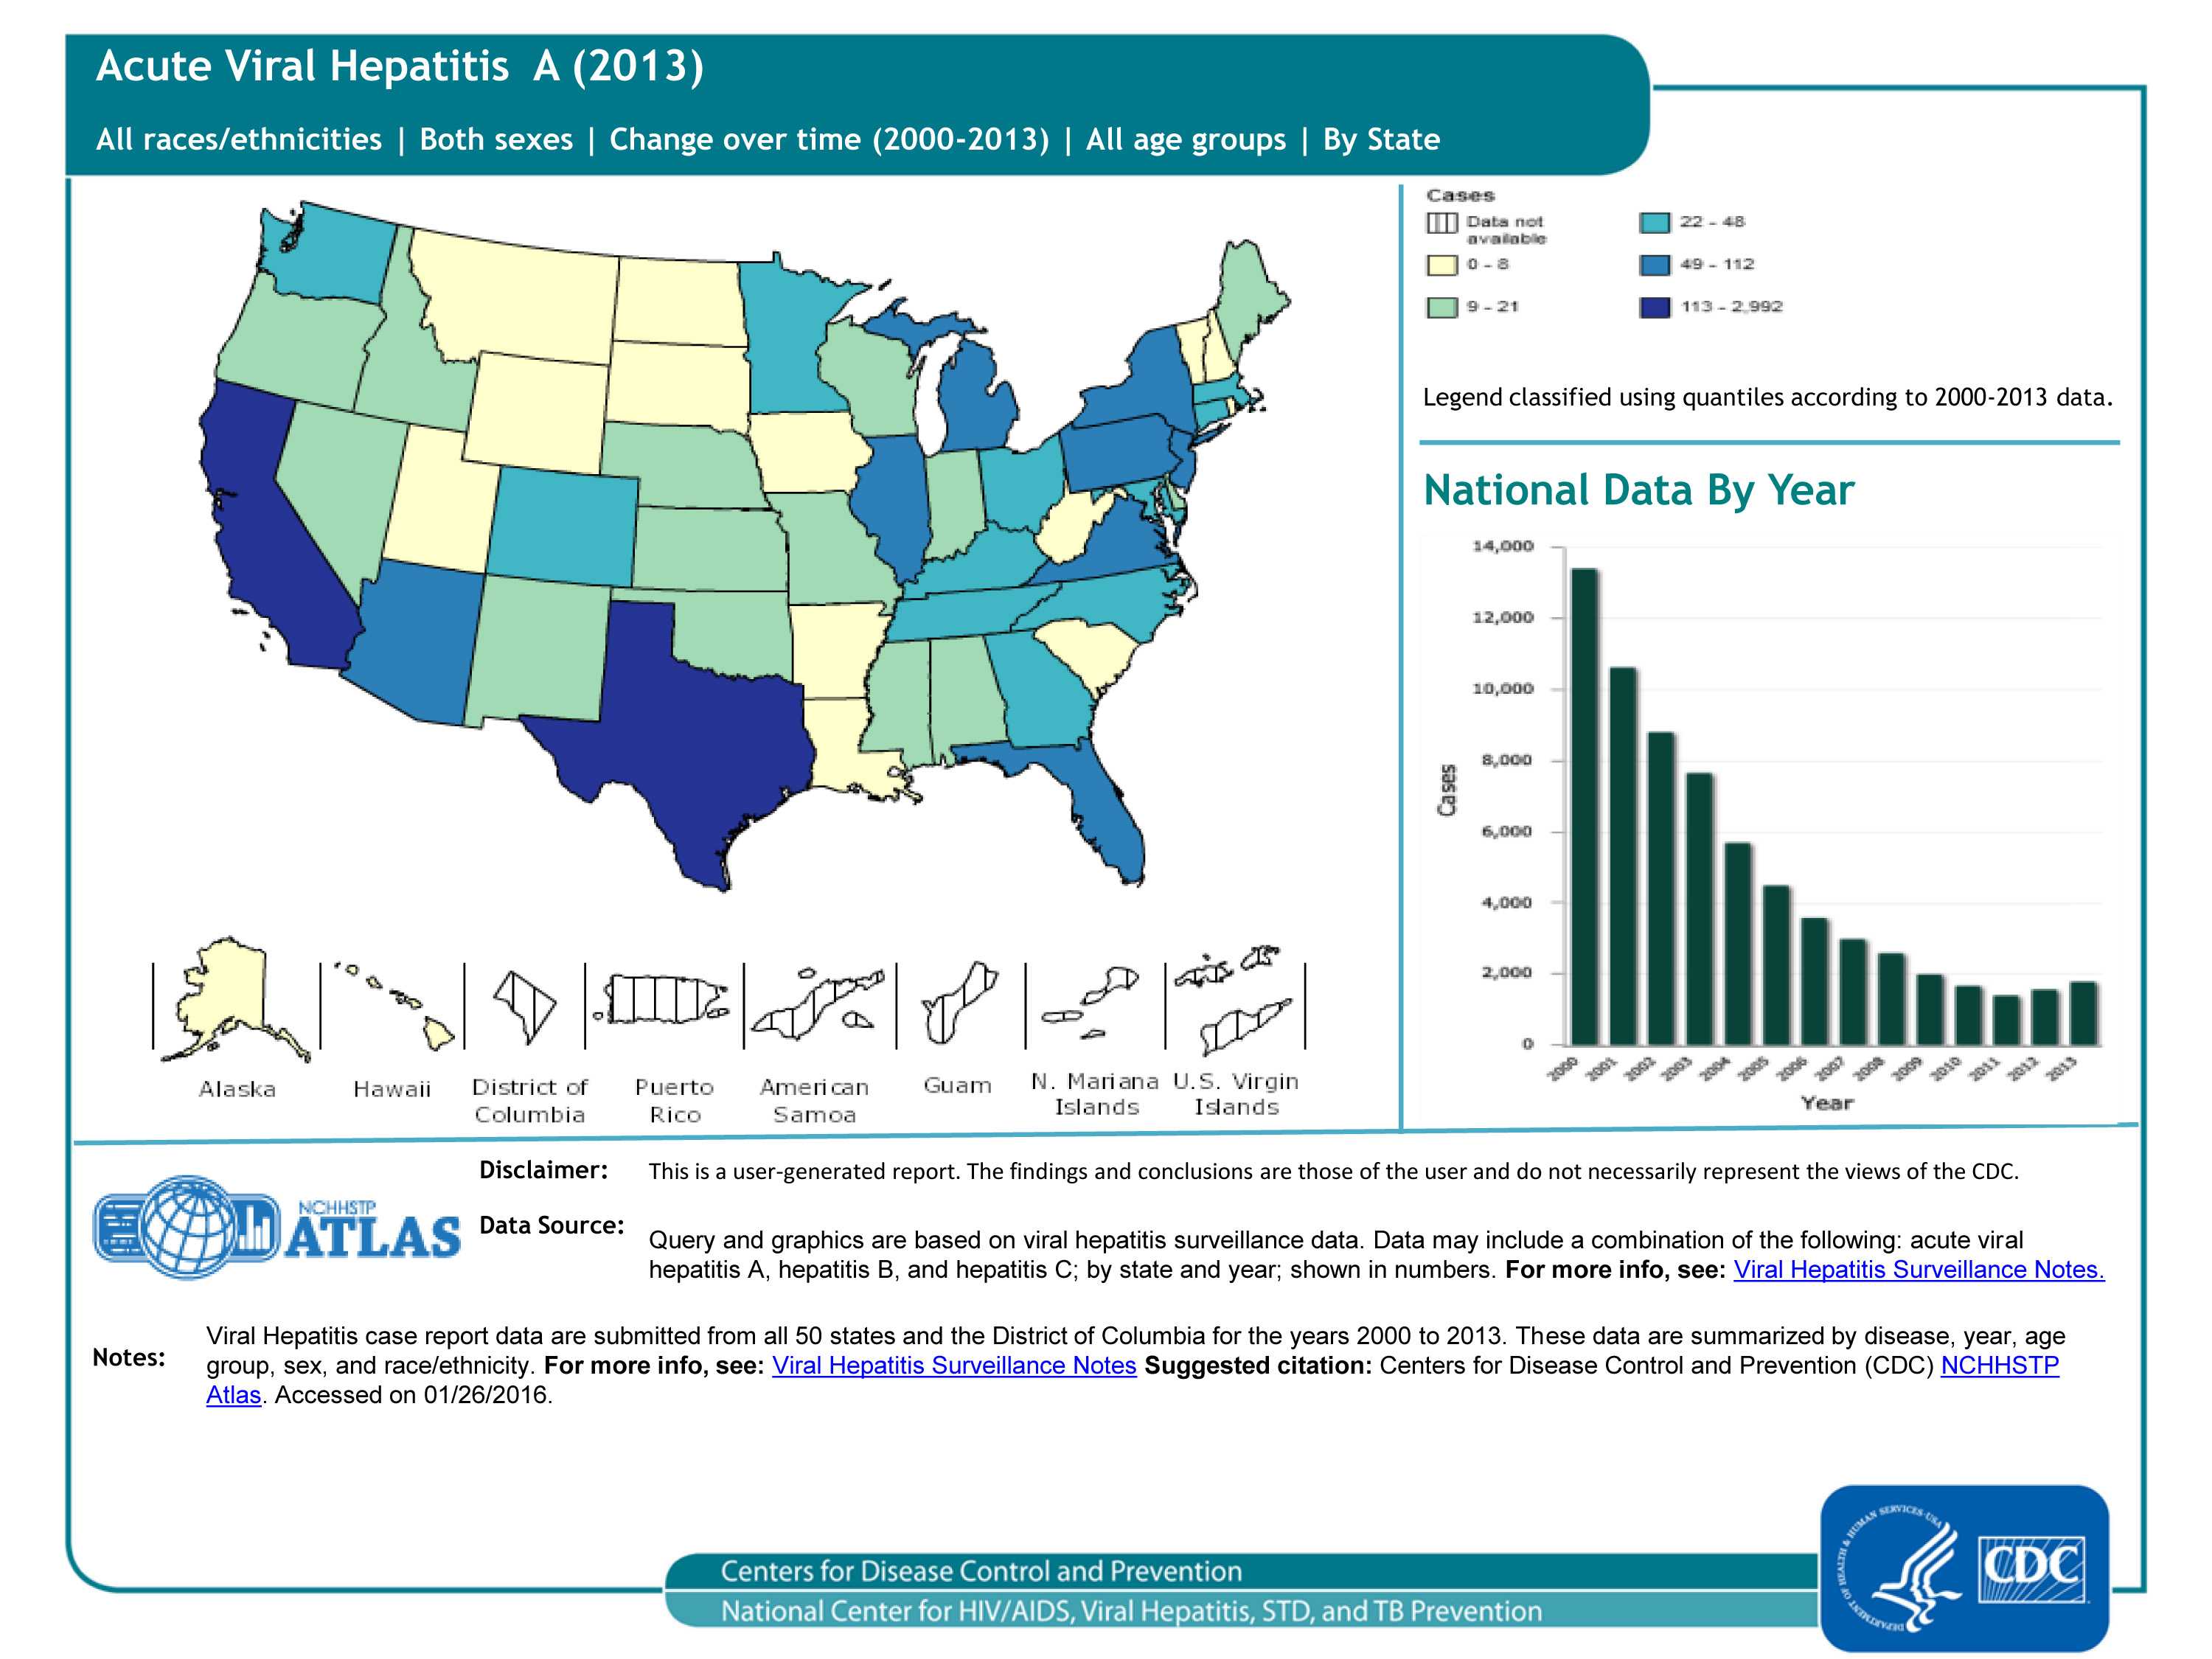
Reported Acute Viral Hepatitis A cases, 50 states and DC
Historically, hepatitis A rates vary cyclically, with nationwide increases every 10-15 years. The last peak was in 1995; since that time, rates of hepatitis A generally declined until 2011. In 2013, a total of 1,781 cases of hepatitis A were reported from 50 states to CDC, a 14% increase from 2012 (see bar graph).
Note: Acute viral hepatitis cases are submitted to CDC primarily via a passive reporting system (except for a few funded “sentinel sites”); therefore, cases reported from health departments may reflect the capacity of health jurisdictions to detect and report cases rather than true disease activity. For more information, please see https://www.cdc.gov/hepatitis/statistics/2013surveillance/index.htm
Slide 4
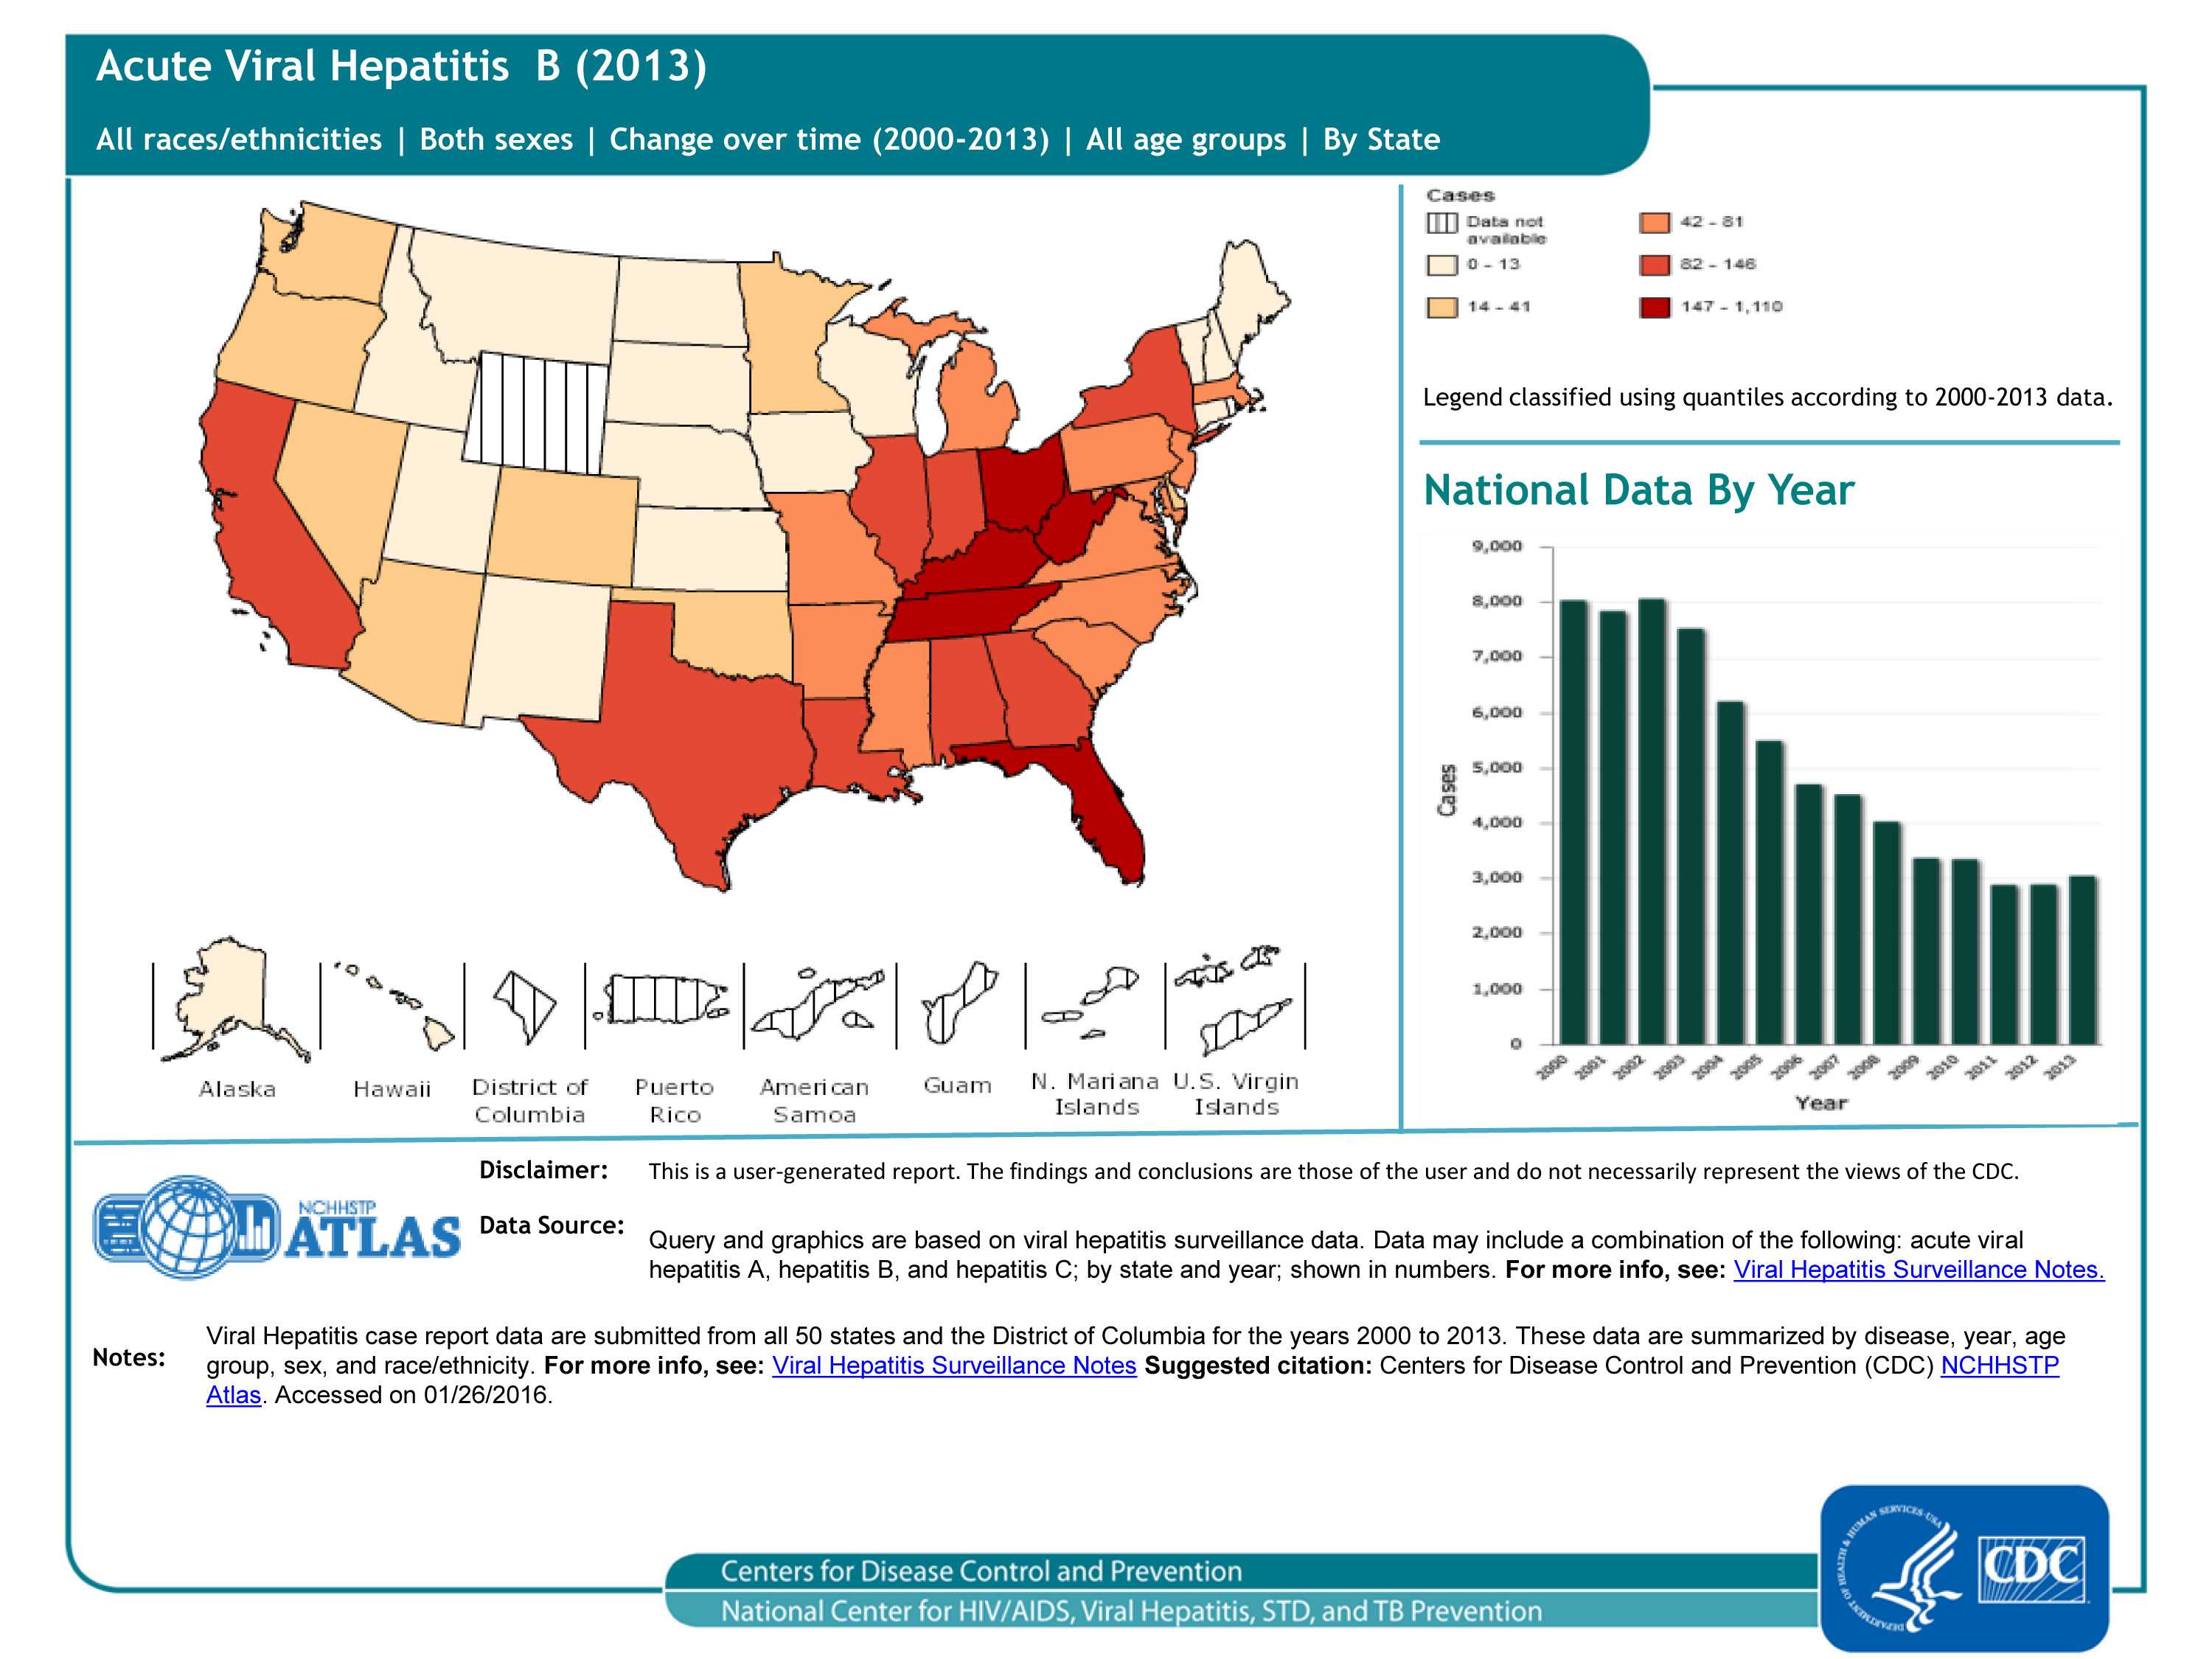
Reported Acute Viral Hepatitis B cases, 50 states and DC
The number of acute cases of hepatitis B decreased by 9.5% during 2009–2013, from 3,371 reported cases to 3,050 reported cases (see graph); increases in Florida, Indiana, Kentucky, Massachusetts, Mississippi, Missouri, Ohio, Tennessee and West Virginia occurred during this time period.
Note: Acute viral hepatitis cases are submitted to CDC primarily via a passive reporting system (except for a few funded “sentinel sites”); therefore, cases reported from health departments may reflect the capacity of health jurisdictions to detect and report cases rather than true disease activity. For more information, please see https://www.cdc.gov/hepatitis/statistics/2013surveillance/index.htm
Slide 5
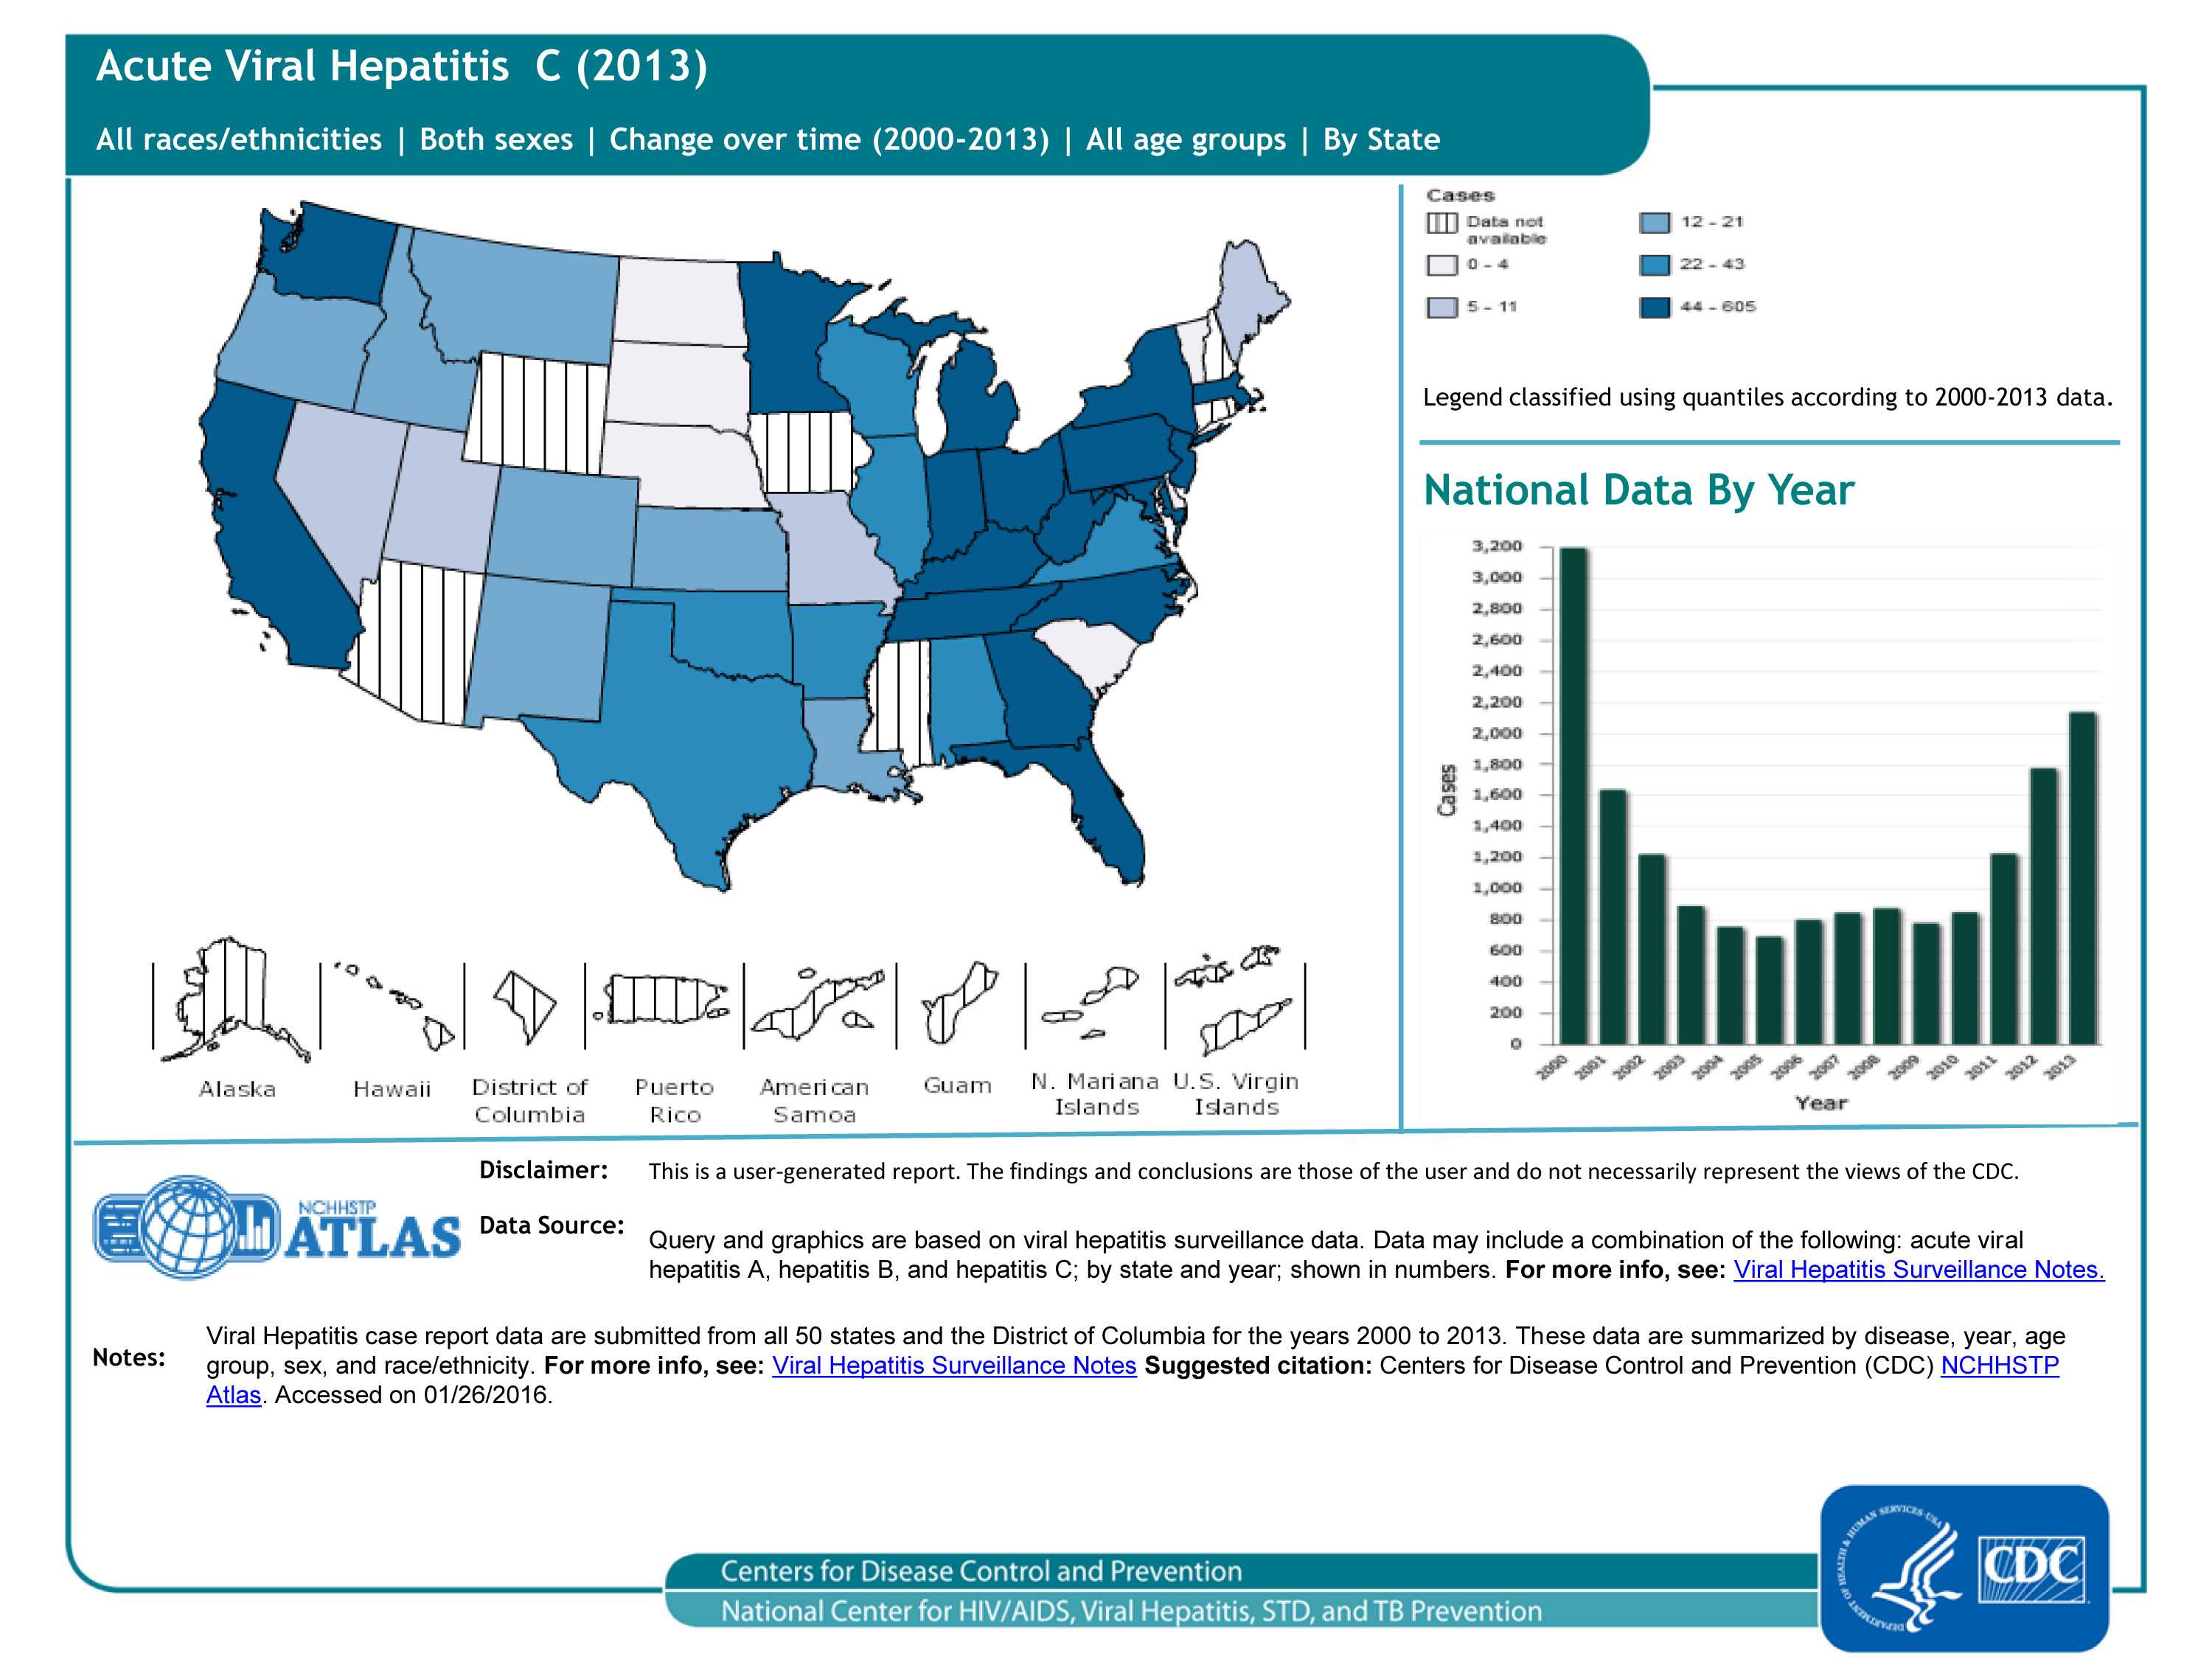
Reported Acute Viral Hepatitis C cases, 50 states and DC
In 2013, a total of 2,138 cases of acute hepatitis C were reported from 41 states to CDC (see graph). The overall incidence rate for 2013 was 0.7 cases per 100,000 population, an increase from 2009-2012. After adjusting for under-ascertainment and under-reporting, an estimated 29,718 acute hepatitis C cases occurred in 2013.
Note: Acute viral hepatitis cases are submitted to CDC primarily via a passive reporting system (except for a few funded “sentinel sites”); therefore, cases reported from health departments may reflect the capacity of health jurisdictions to detect and report cases rather than true disease activity. For more information, please see https://www.cdc.gov/hepatitis/statistics/2013surveillance/index.htm
Slide 6
To learn more about the diseases:
- HIV
- Chlamydia, Gonorrhea, Syphilis
- Acute Viral Hepatitis A, Acute Viral Hepatitis B, and Acute Viral Hepatitis C
- Tuberculosis (TB)
For data sources:
- Page last reviewed: January 25, 2017
- Page last updated: January 25, 2017
- Content source: