

STD Recommended Queries
 ShareCompartir
Download STD slideset: pdf version | PowerPoint version
Slide 1
Division of STD Prevention scientific staff drafted these to highlight some of the most important data. In this notes area of the PowerPoint slides, each slide contains the title (with the variables selected), some contextual information, and links to additional data and information on the topic.
All of the NCHHSTP AtlasPlus maps are choropleth maps, which use sequential colors (e.g., light blue to dark blue) to display data that progress from low to high values. Typically, one uses light colors for low data values and dark colors for high data values.
Slide 2
The NCHHSTP AtlasPlus is an online, interactive tool that gives you the power to analyze, map, and create tables using HIV, viral hepatitis, STD, and TB data that are reported to CDC.
Using the NCHHSTP AtlasPlus, you can:
- Create custom maps and bar graphs using HIV, viral hepatitis, STD, or TB data (NCHHSTP AtlasPlus has 15 disease variables to explore);
- View a list of diagnoses for most recent year and change from the previous year;
- Create 2 side-by-side maps or charts (e.g., 2 diseases, 2 race/ethnicity groups, or 2 age groups);
- Display changes over time and patterns across the United States (NCHHSTP AtlasPlus has 16 years of data for most variables); Generate Charts:
- Line graphs by year
- Pie charts for sex
- Bar charts for age, race/ethnicity, transmission category (HIV), country of birth (TB)
- Bar charts for state and country; and,
- Download data and export graphics.
Slide 3
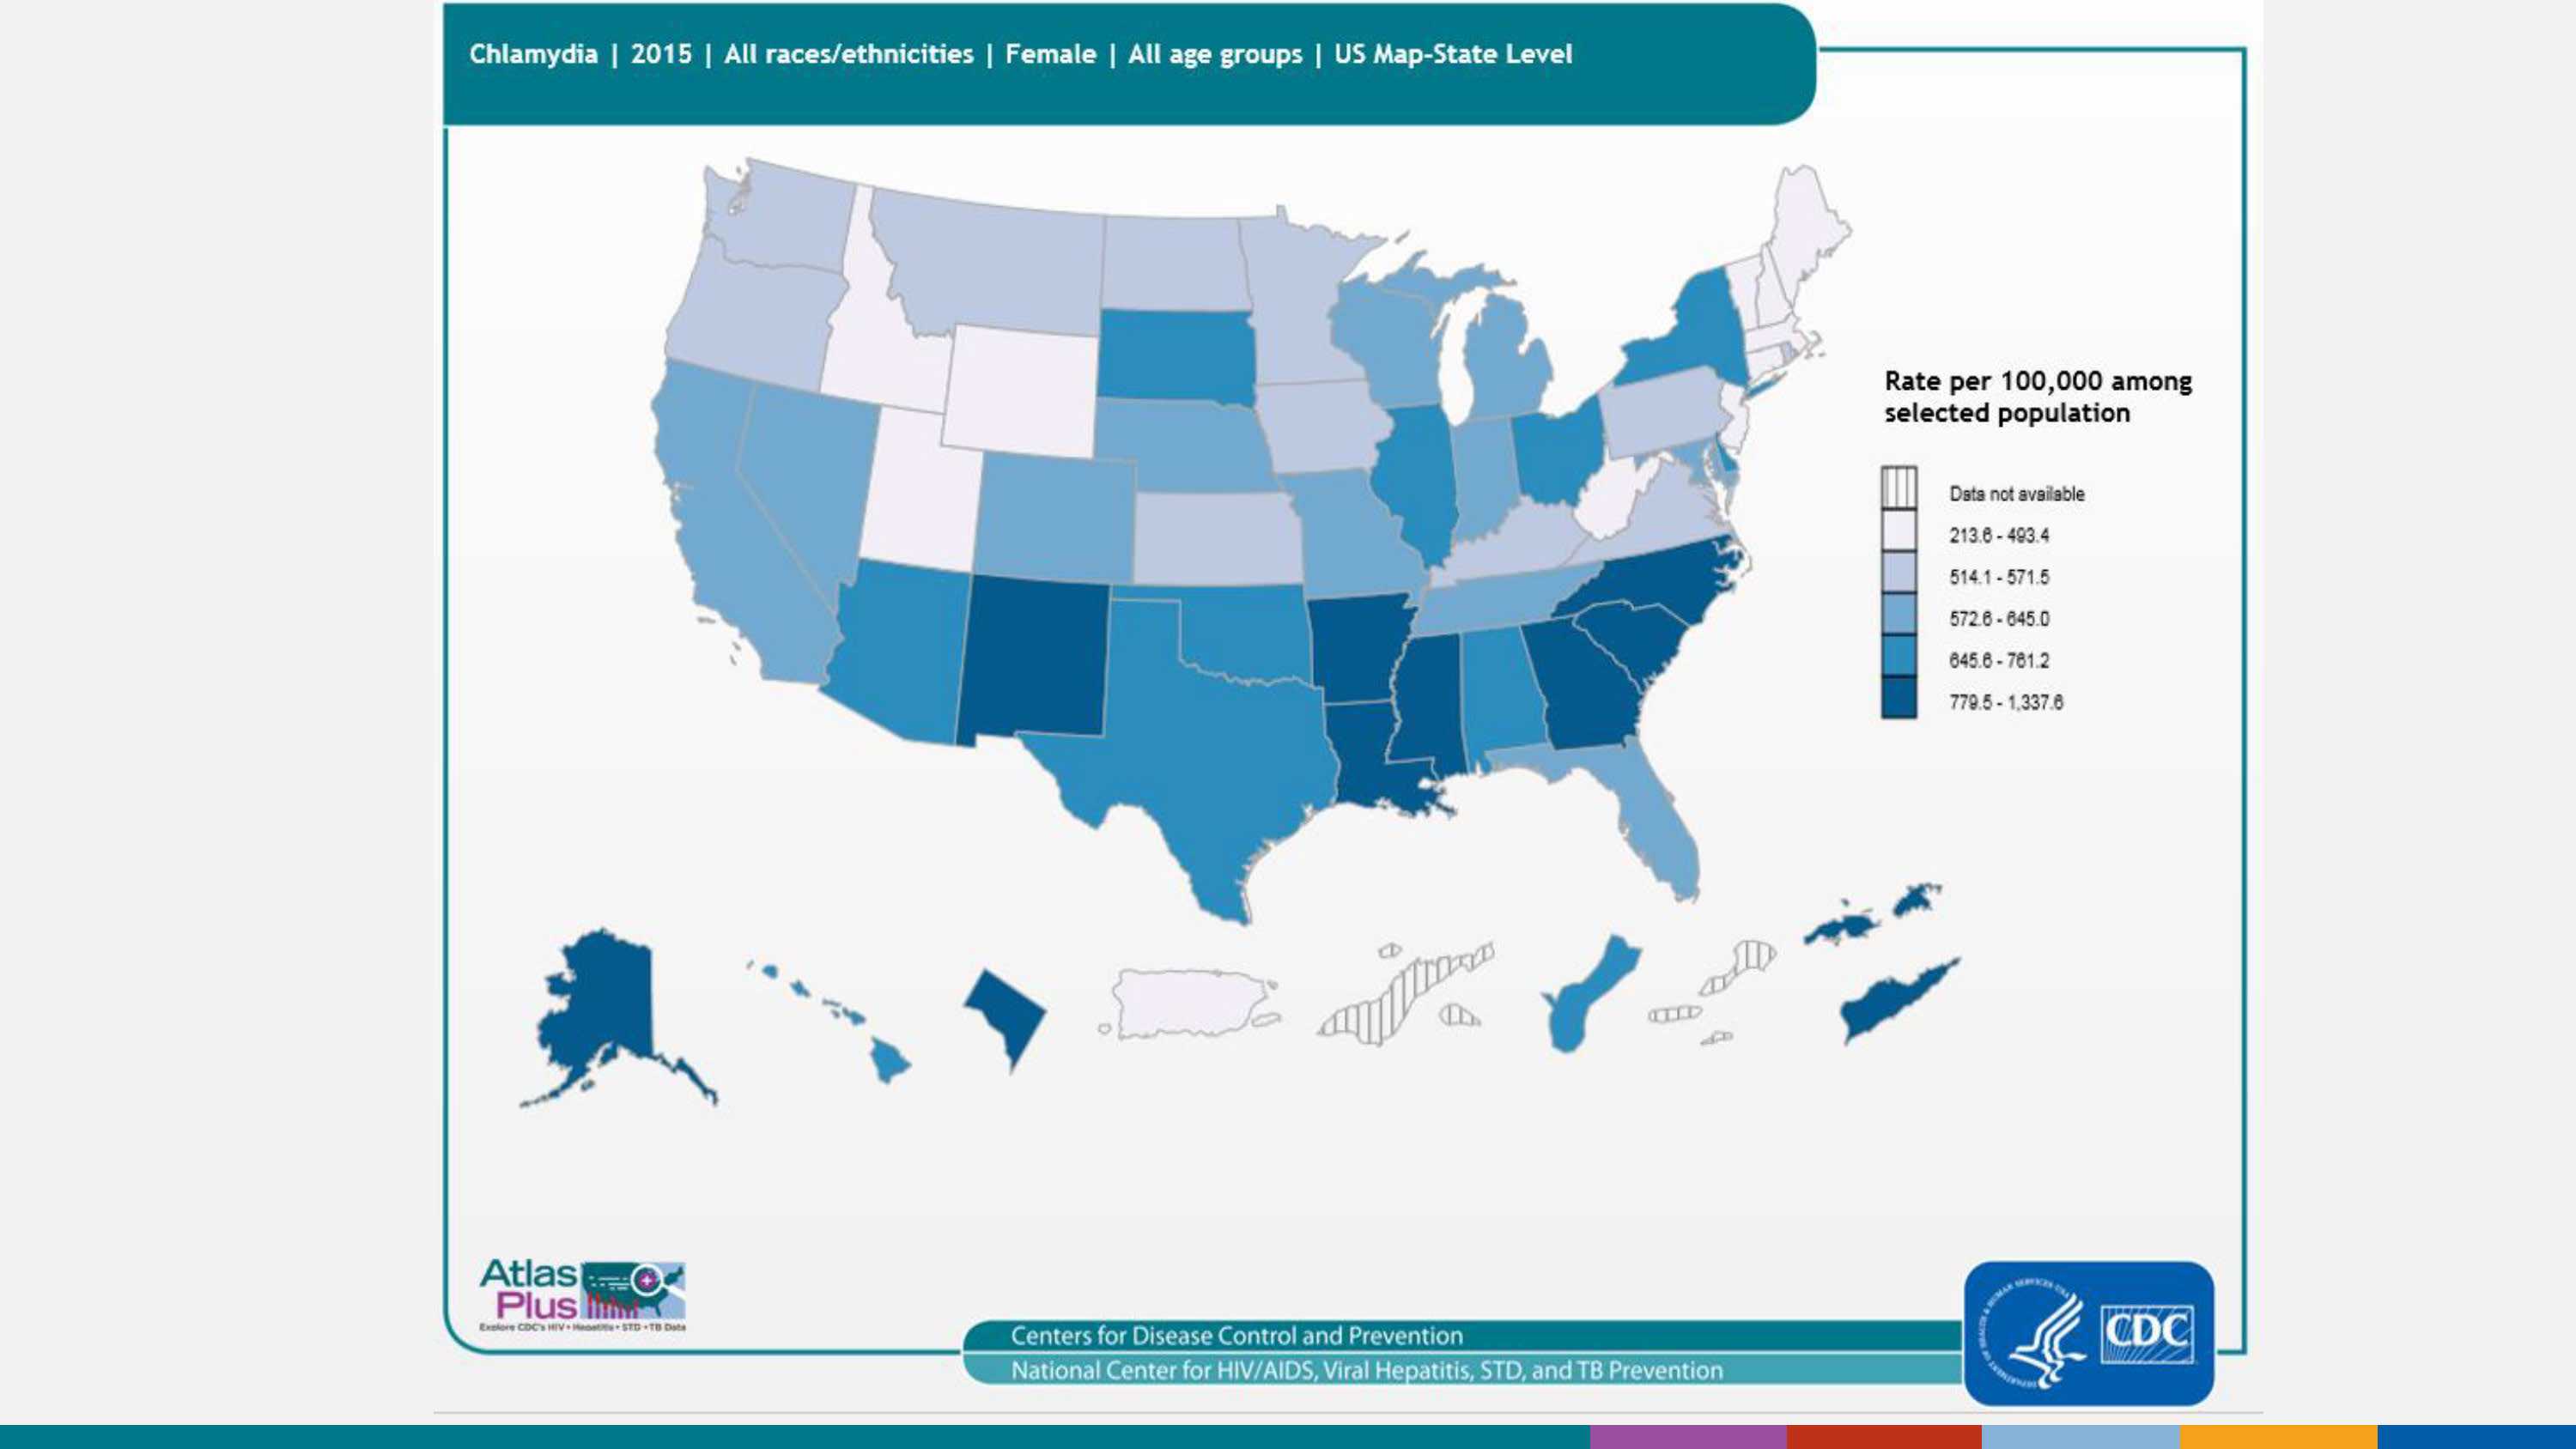
Chlamydia cases among females (2015), 50 states, DC, and outlying areas, by state/area
Trends in rates of reported cases of chlamydia are influenced by changes in incidence of infection, as well as changes in diagnostic, screening, and reporting practices. As chlamydial infections are usually asymptomatic, the number of infections identified and reported can increase as more people are screened even when incidence is flat or decreasing. Females and infants disproportionately bear the long-term consequences of STDs. Females infected with C. trachomatis or N. gonorrhoeae can develop pelvic inflammatory disease, which, in turn, can lead to reproductive system morbidity such as ectopic pregnancy and tubal factor infertility. As seen in the map, the highest rates of reported chlamydia among females in 2015 are in the south.
For more information: https://www.cdc.gov/std/infertility/default.htm
Slide 4
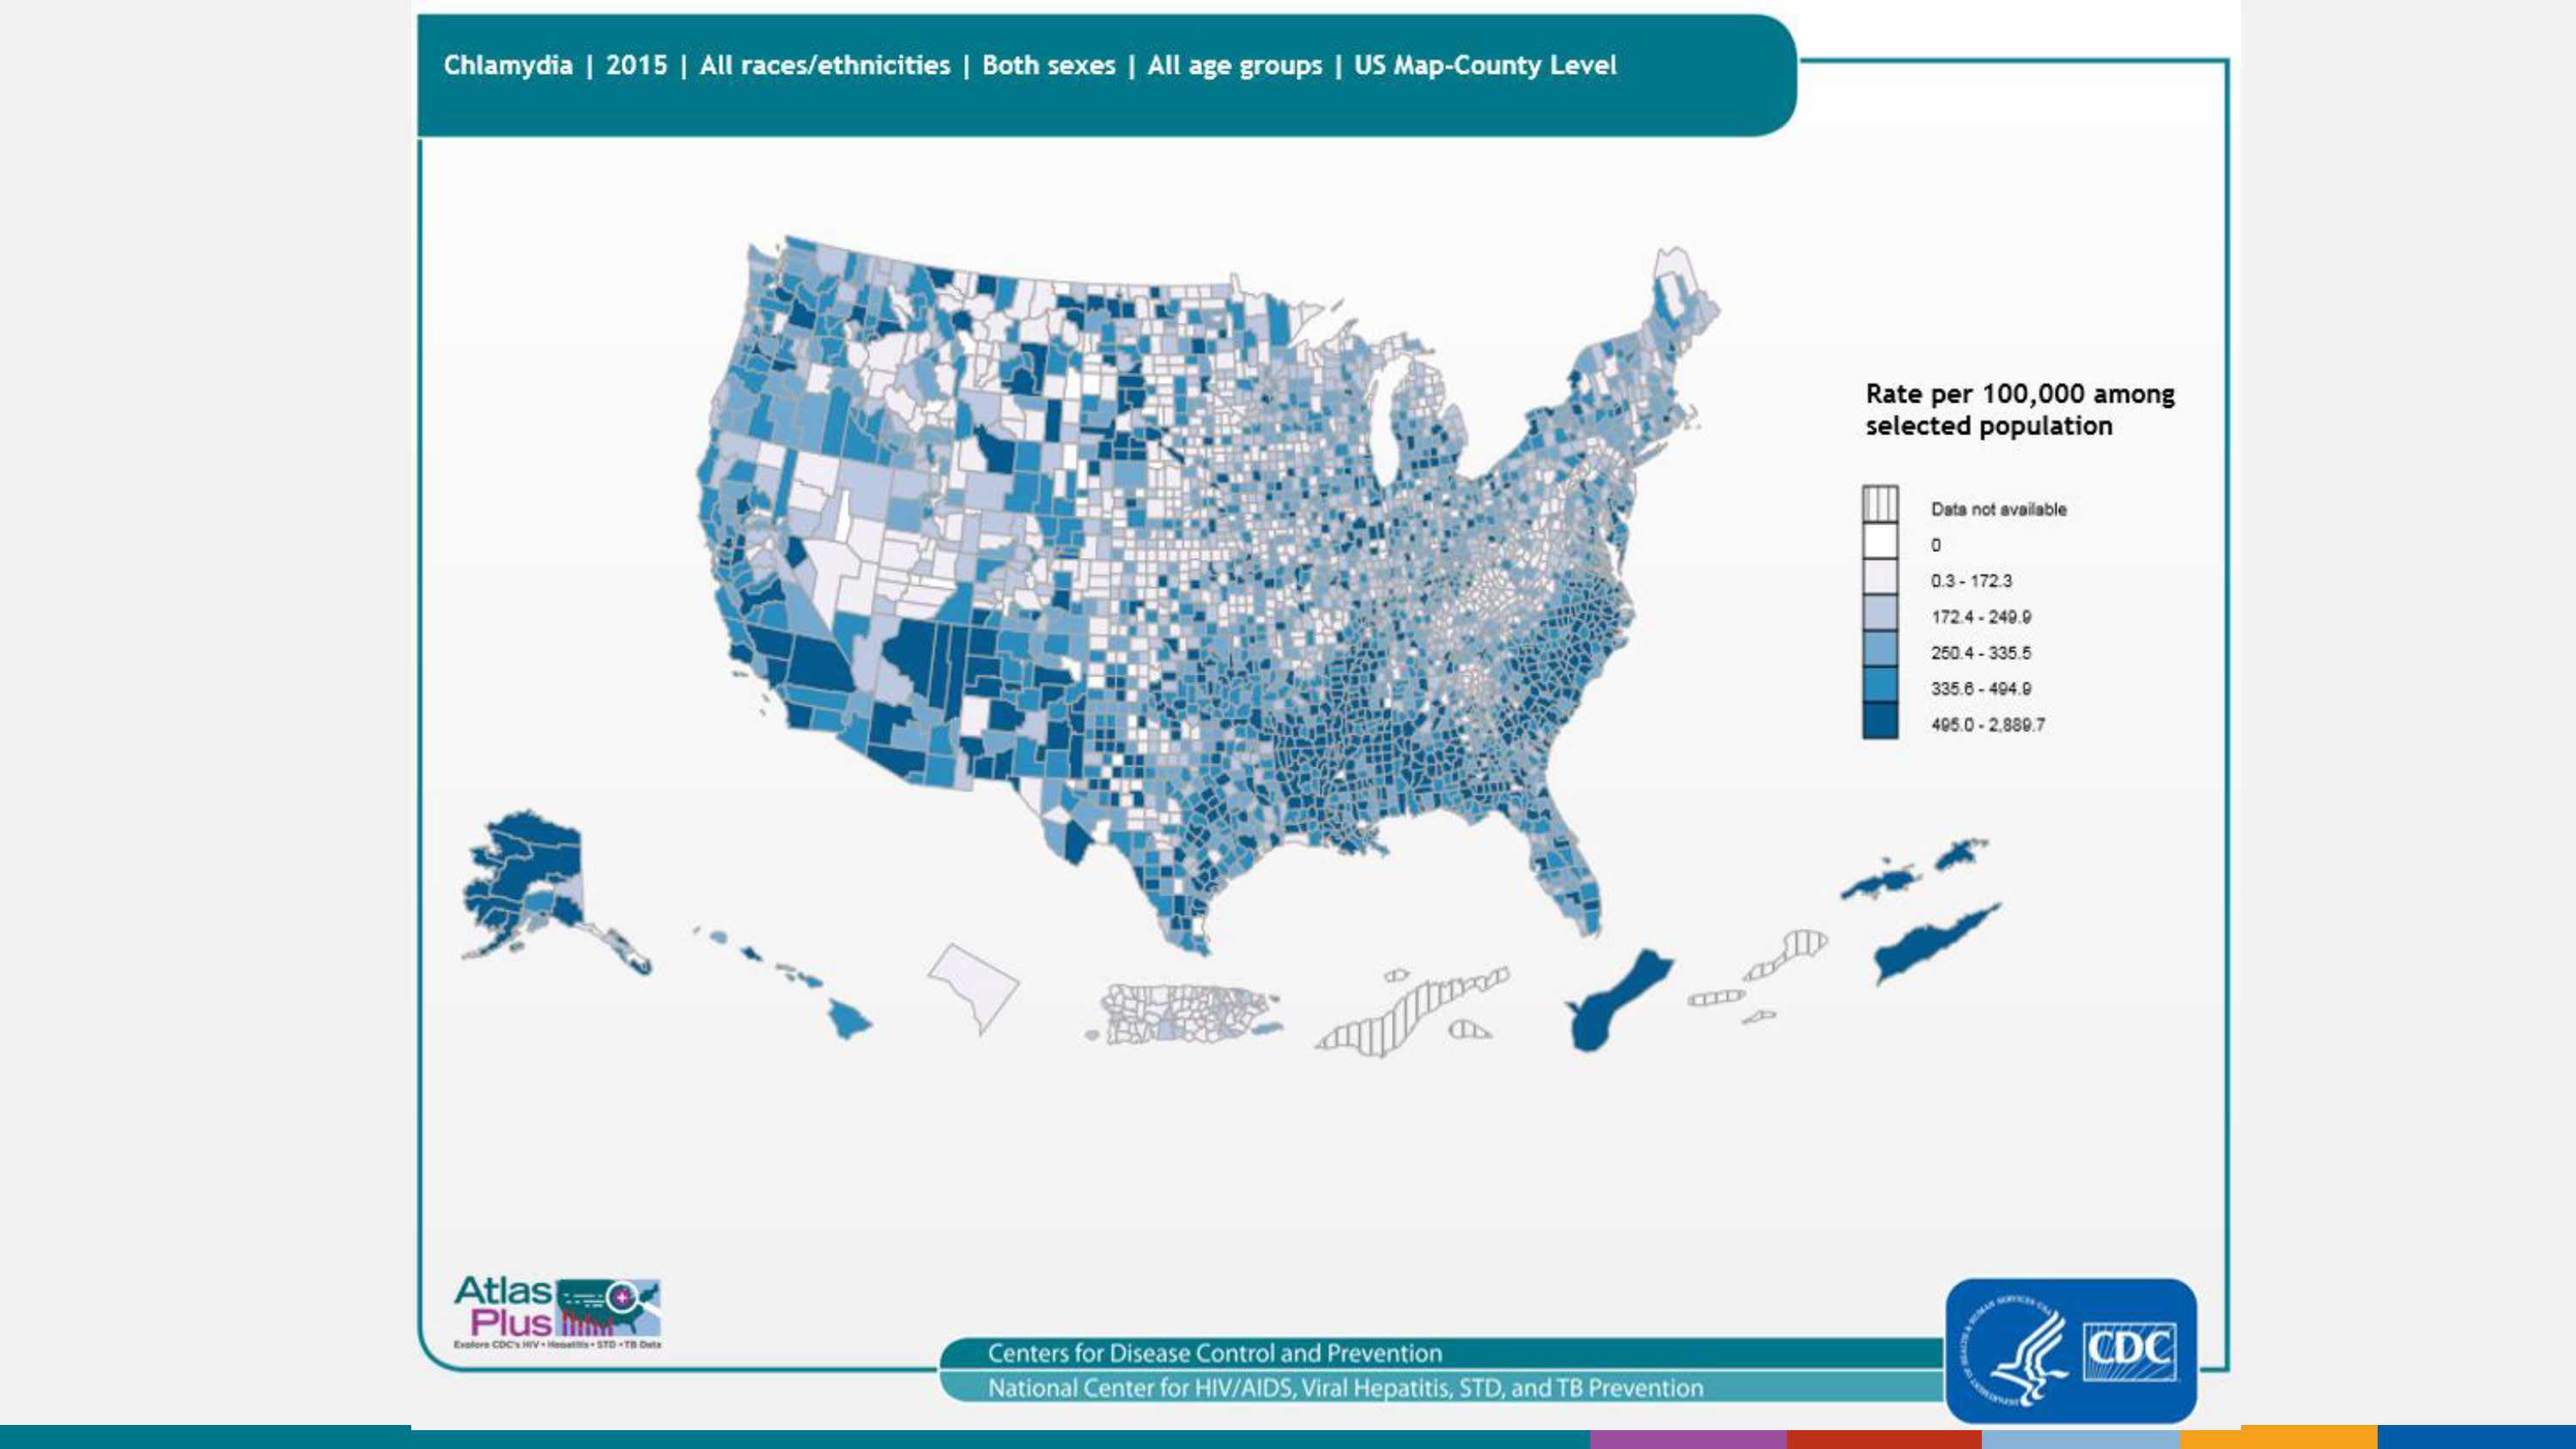
Chlamydia cases (2015), 50 states, DC, and outlying areas, by county
Trends in rates of reported cases of chlamydia are influenced by changes in incidence of infection, as well as changes in diagnostic, screening, and reporting practices. As chlamydial infections are usually asymptomatic, the number of infections identified and reported can increase as more people are screened even when incidence is flat or decreasing. Generally speaking, the highest rates of reported chlamydia in 2015 are in many counties of the southern and western US, as well as Guam and the US Virgin Islands.
For more information: https://www.cdc.gov/std/chlamydia/default.htm
Slide 5
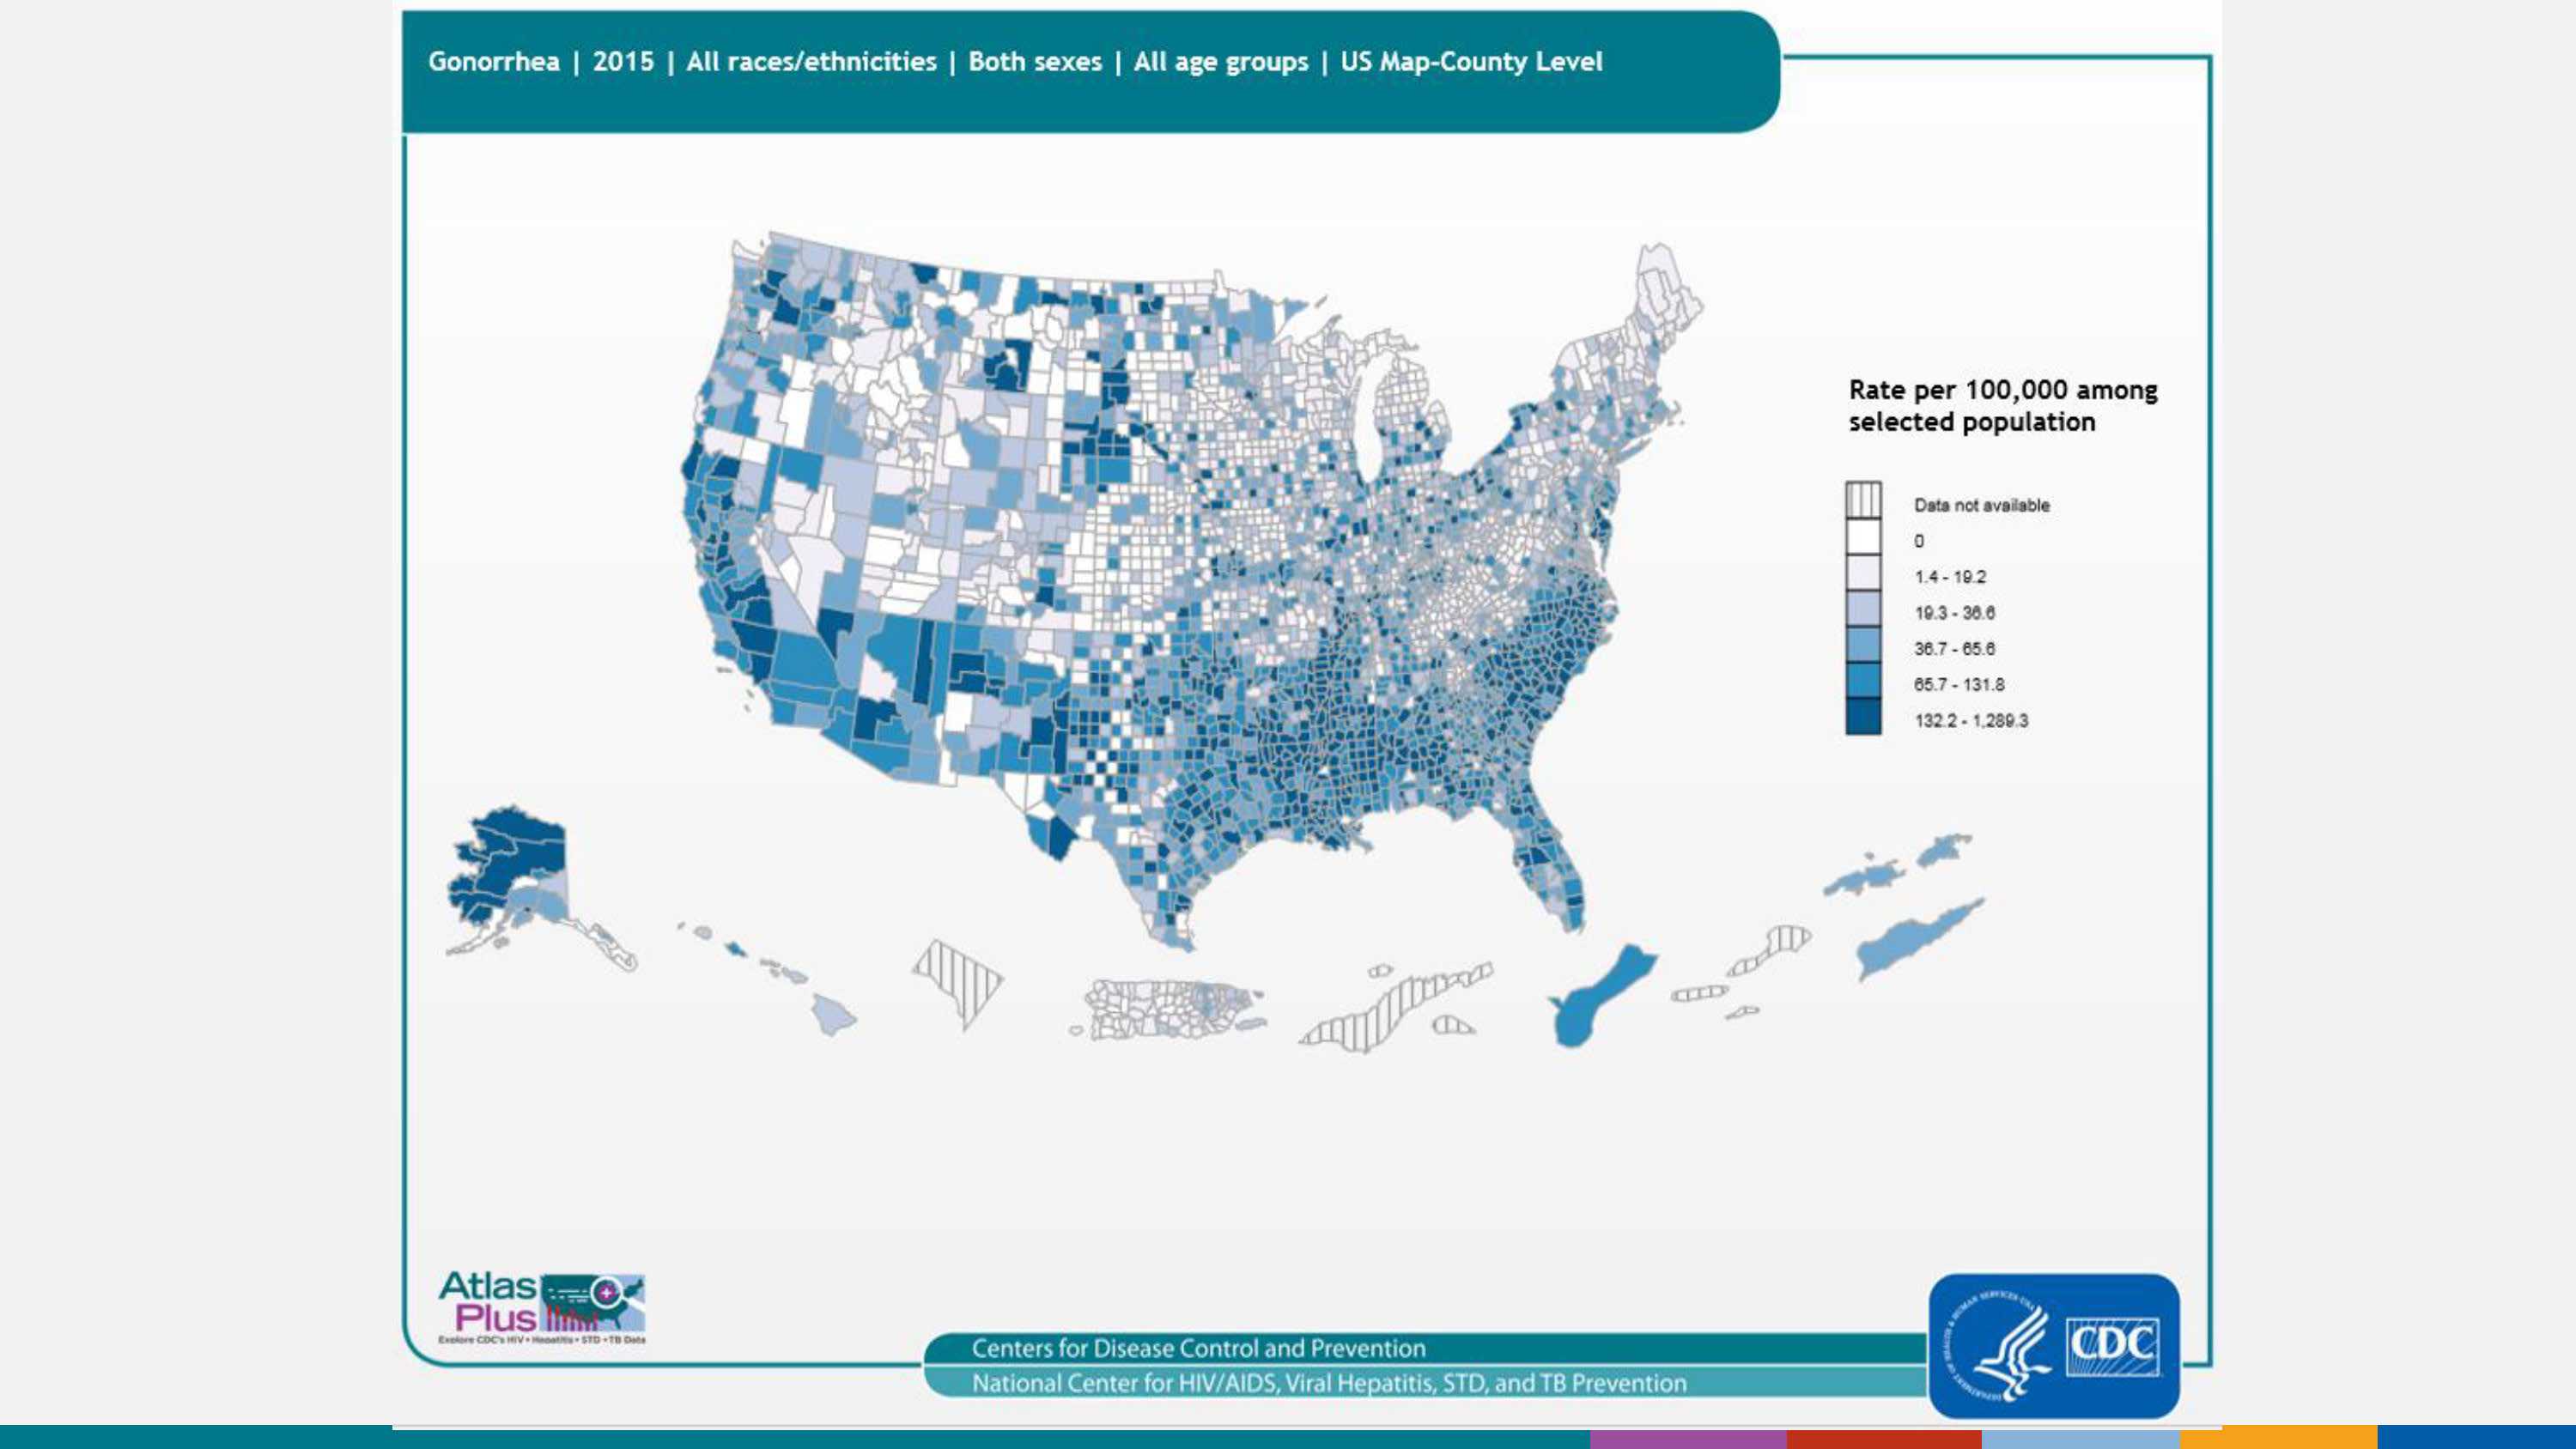
Gonorrhea cases (2015), 50 states, DC, and outlying areas, by county
The national gonorrhea rate reached the lowest level ever recorded in 2009, but has increased slightly each year since then. County-level data can illustrate gonorrhea patterns within states, as well as cross-state patterns and networks affecting public health. As seen in the map, in 2015 rates of reported gonorrhea are high in many counties of the southern and western US.
For more information: https://www.cdc.gov/std/gonorrhea/default.htm
Slide 6
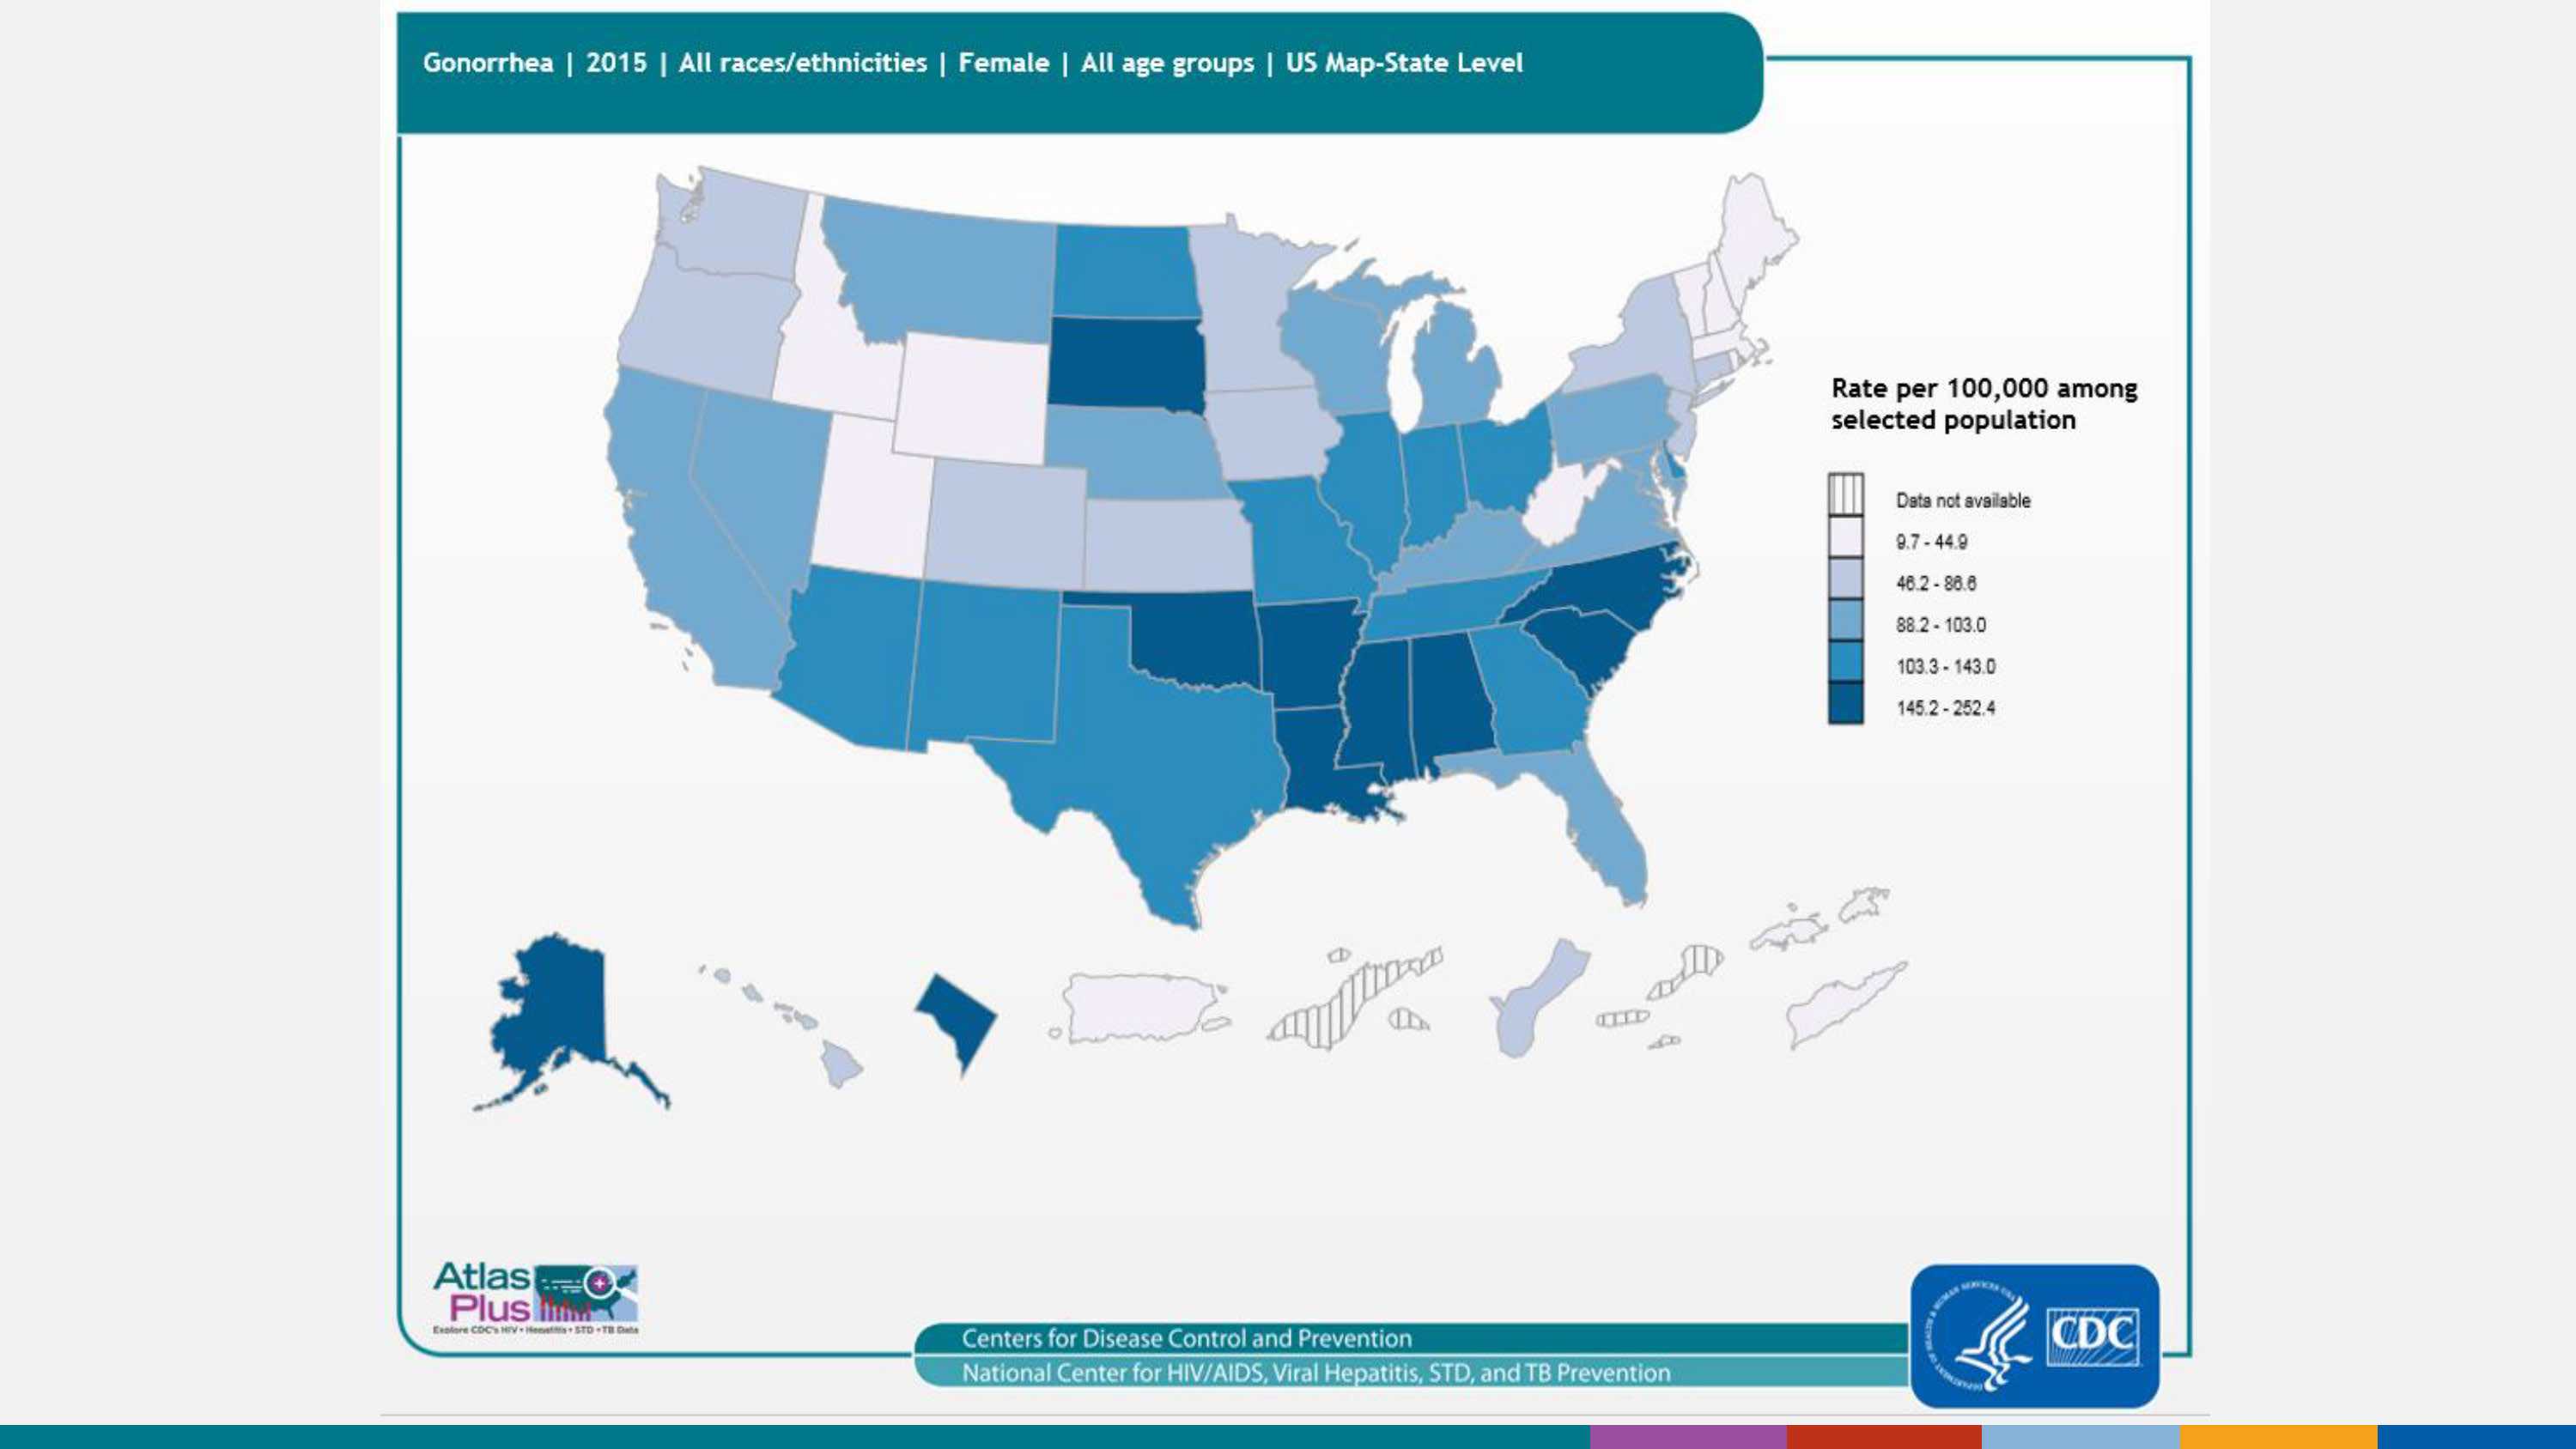
Gonorrhea cases among females (2015), 50 states, DC, and outlying areas, by state
The national gonorrhea rate reached the lowest level ever recorded in 2009, but has increased slightly each year since then. As seen in the map, in 2015 rates of reported gonorrhea among females are highest in the south, South Dakota, and Alaska.
For more information: https://www.cdc.gov/std/gonorrhea/default.htm
Slide 7
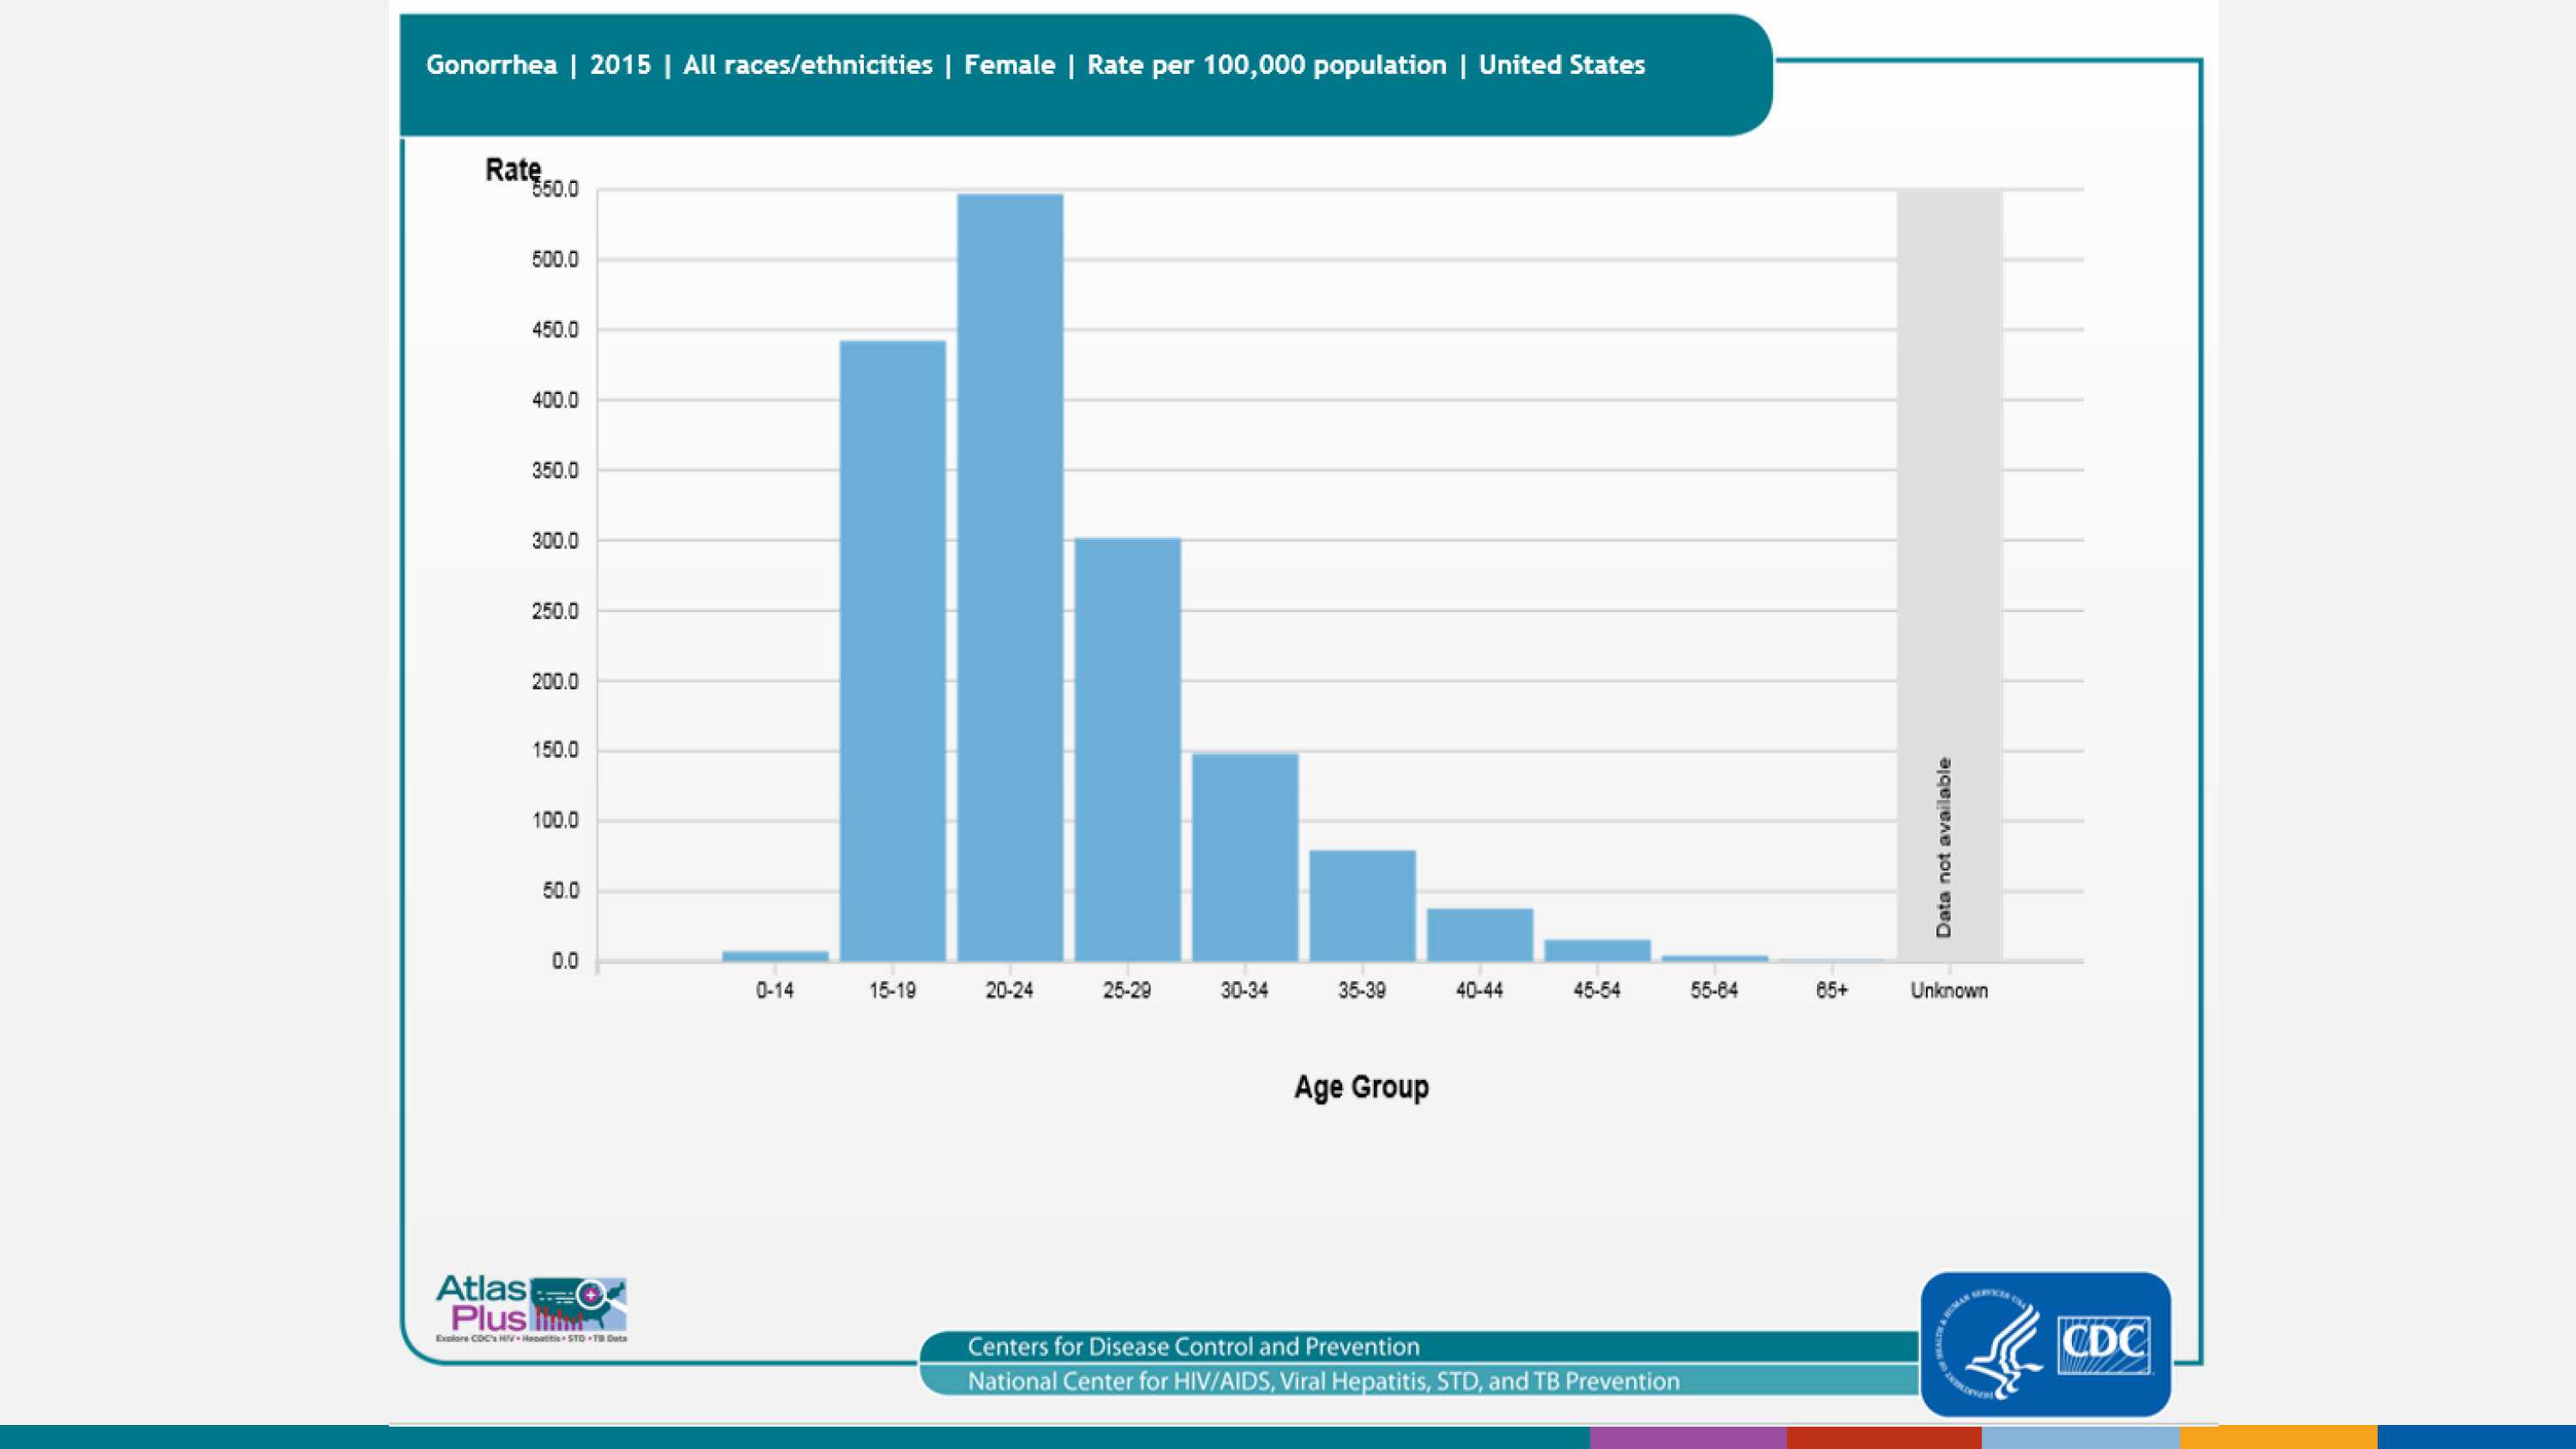
Gonorrhea cases among females (2015), 50 states, DC, and outlying areas
As seen in the bar chart, in 2015 rates of reported gonorrhea among females are highest among 20-24 year olds, followed by 15-19 year old females.
For more information: https://www.cdc.gov/std/gonorrhea/default.htm
Slide 8
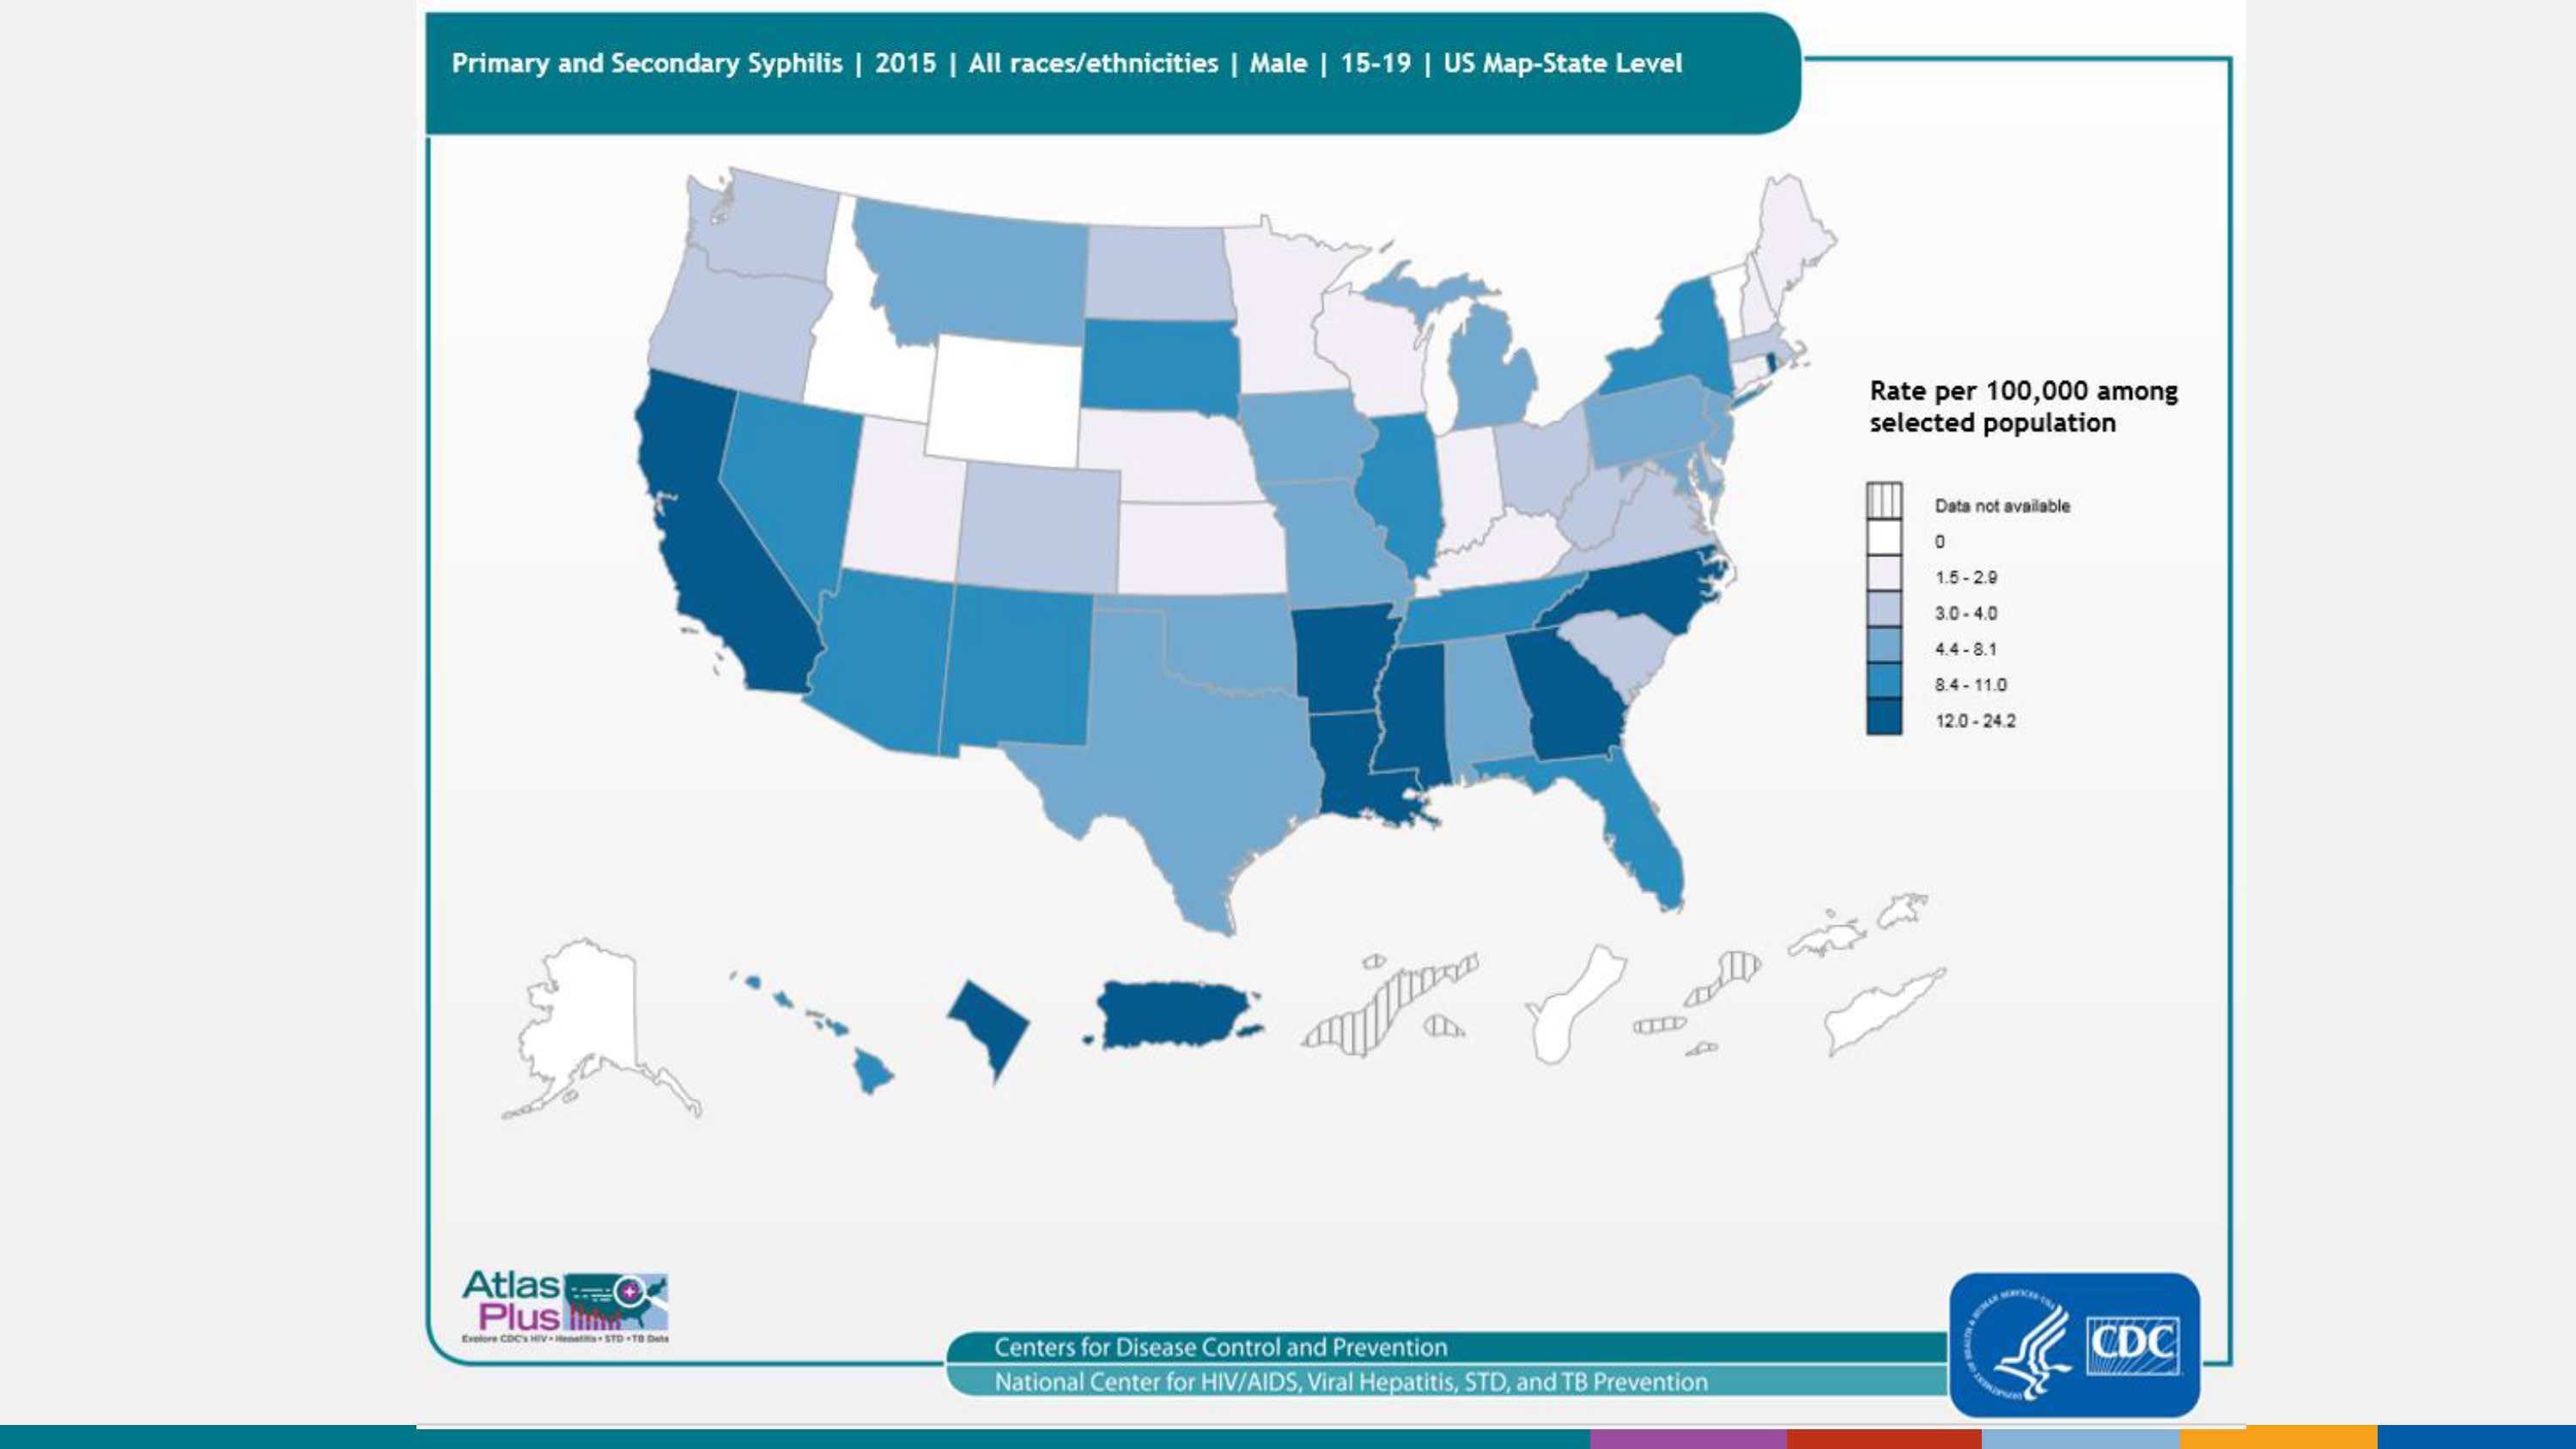
Primary and secondary syphilis cases among 15-19 year old males (2015), 50 states, DC, and outlying areas, by state/area
Although rates among males aged 15–19 years are much lower than those of males in older age groups, rates in this group have increased from 1.6 cases per 100,000 population in 2000 to 8.0 cases per 100,000 population in 2015. As seen in the map, the highest rates of primary and secondary syphilis among males aged 15 to 19 in 2015 are in the south, California, Rhode Island, District of Columbia, and Puerto Rico.
For more information: https://www.cdc.gov/std/syphilis/default.htm
Slide 9
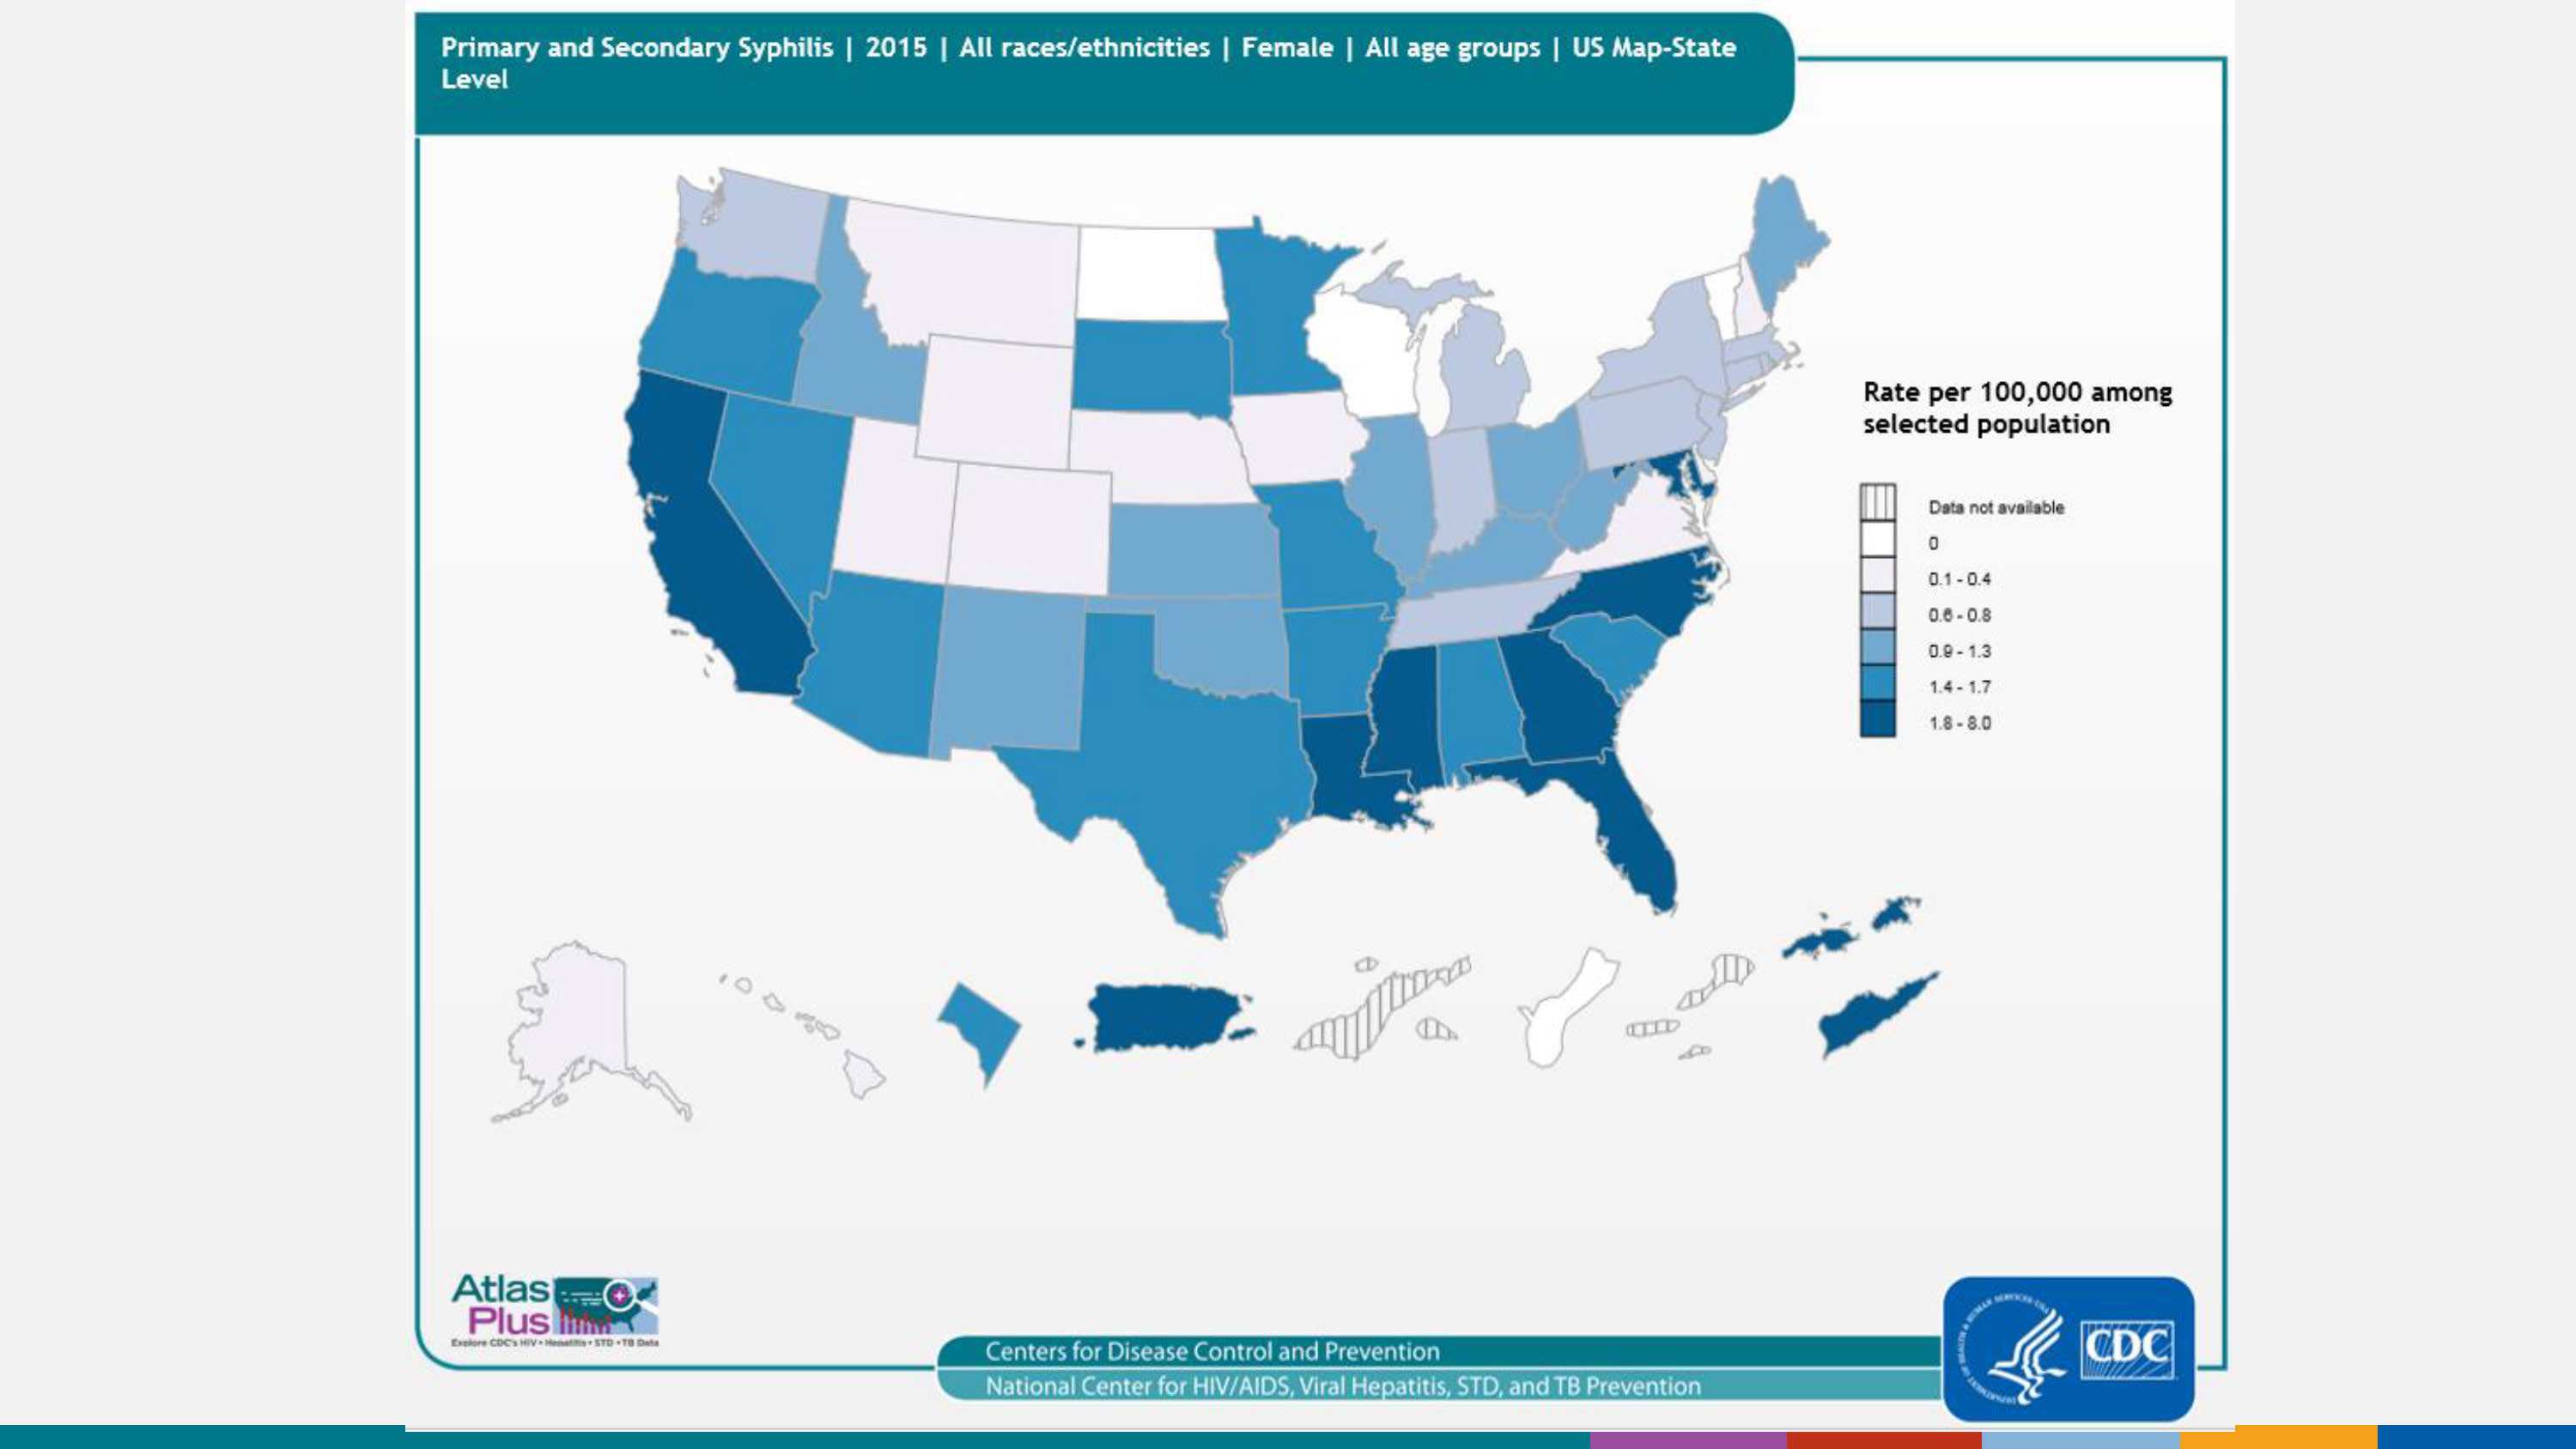
Primary and secondary syphilis cases among females (2015), 50 states, DC, and outlying areas, by state/area
The rate among women has ranged from a low of 0.8 cases per 100,000 observed in 2003 and a high of 1.7 cases per 100,000 in 2007, with the rate in 2015 being 1.4 cases per 100,000. As seen in the map, the highest rates of primary and secondary syphilis among females in 2015 are in the south, California, Puerto Rico, and the US Virgin Islands.
For more information: https://www.cdc.gov/std/syphilis/default.htm
Slide 10
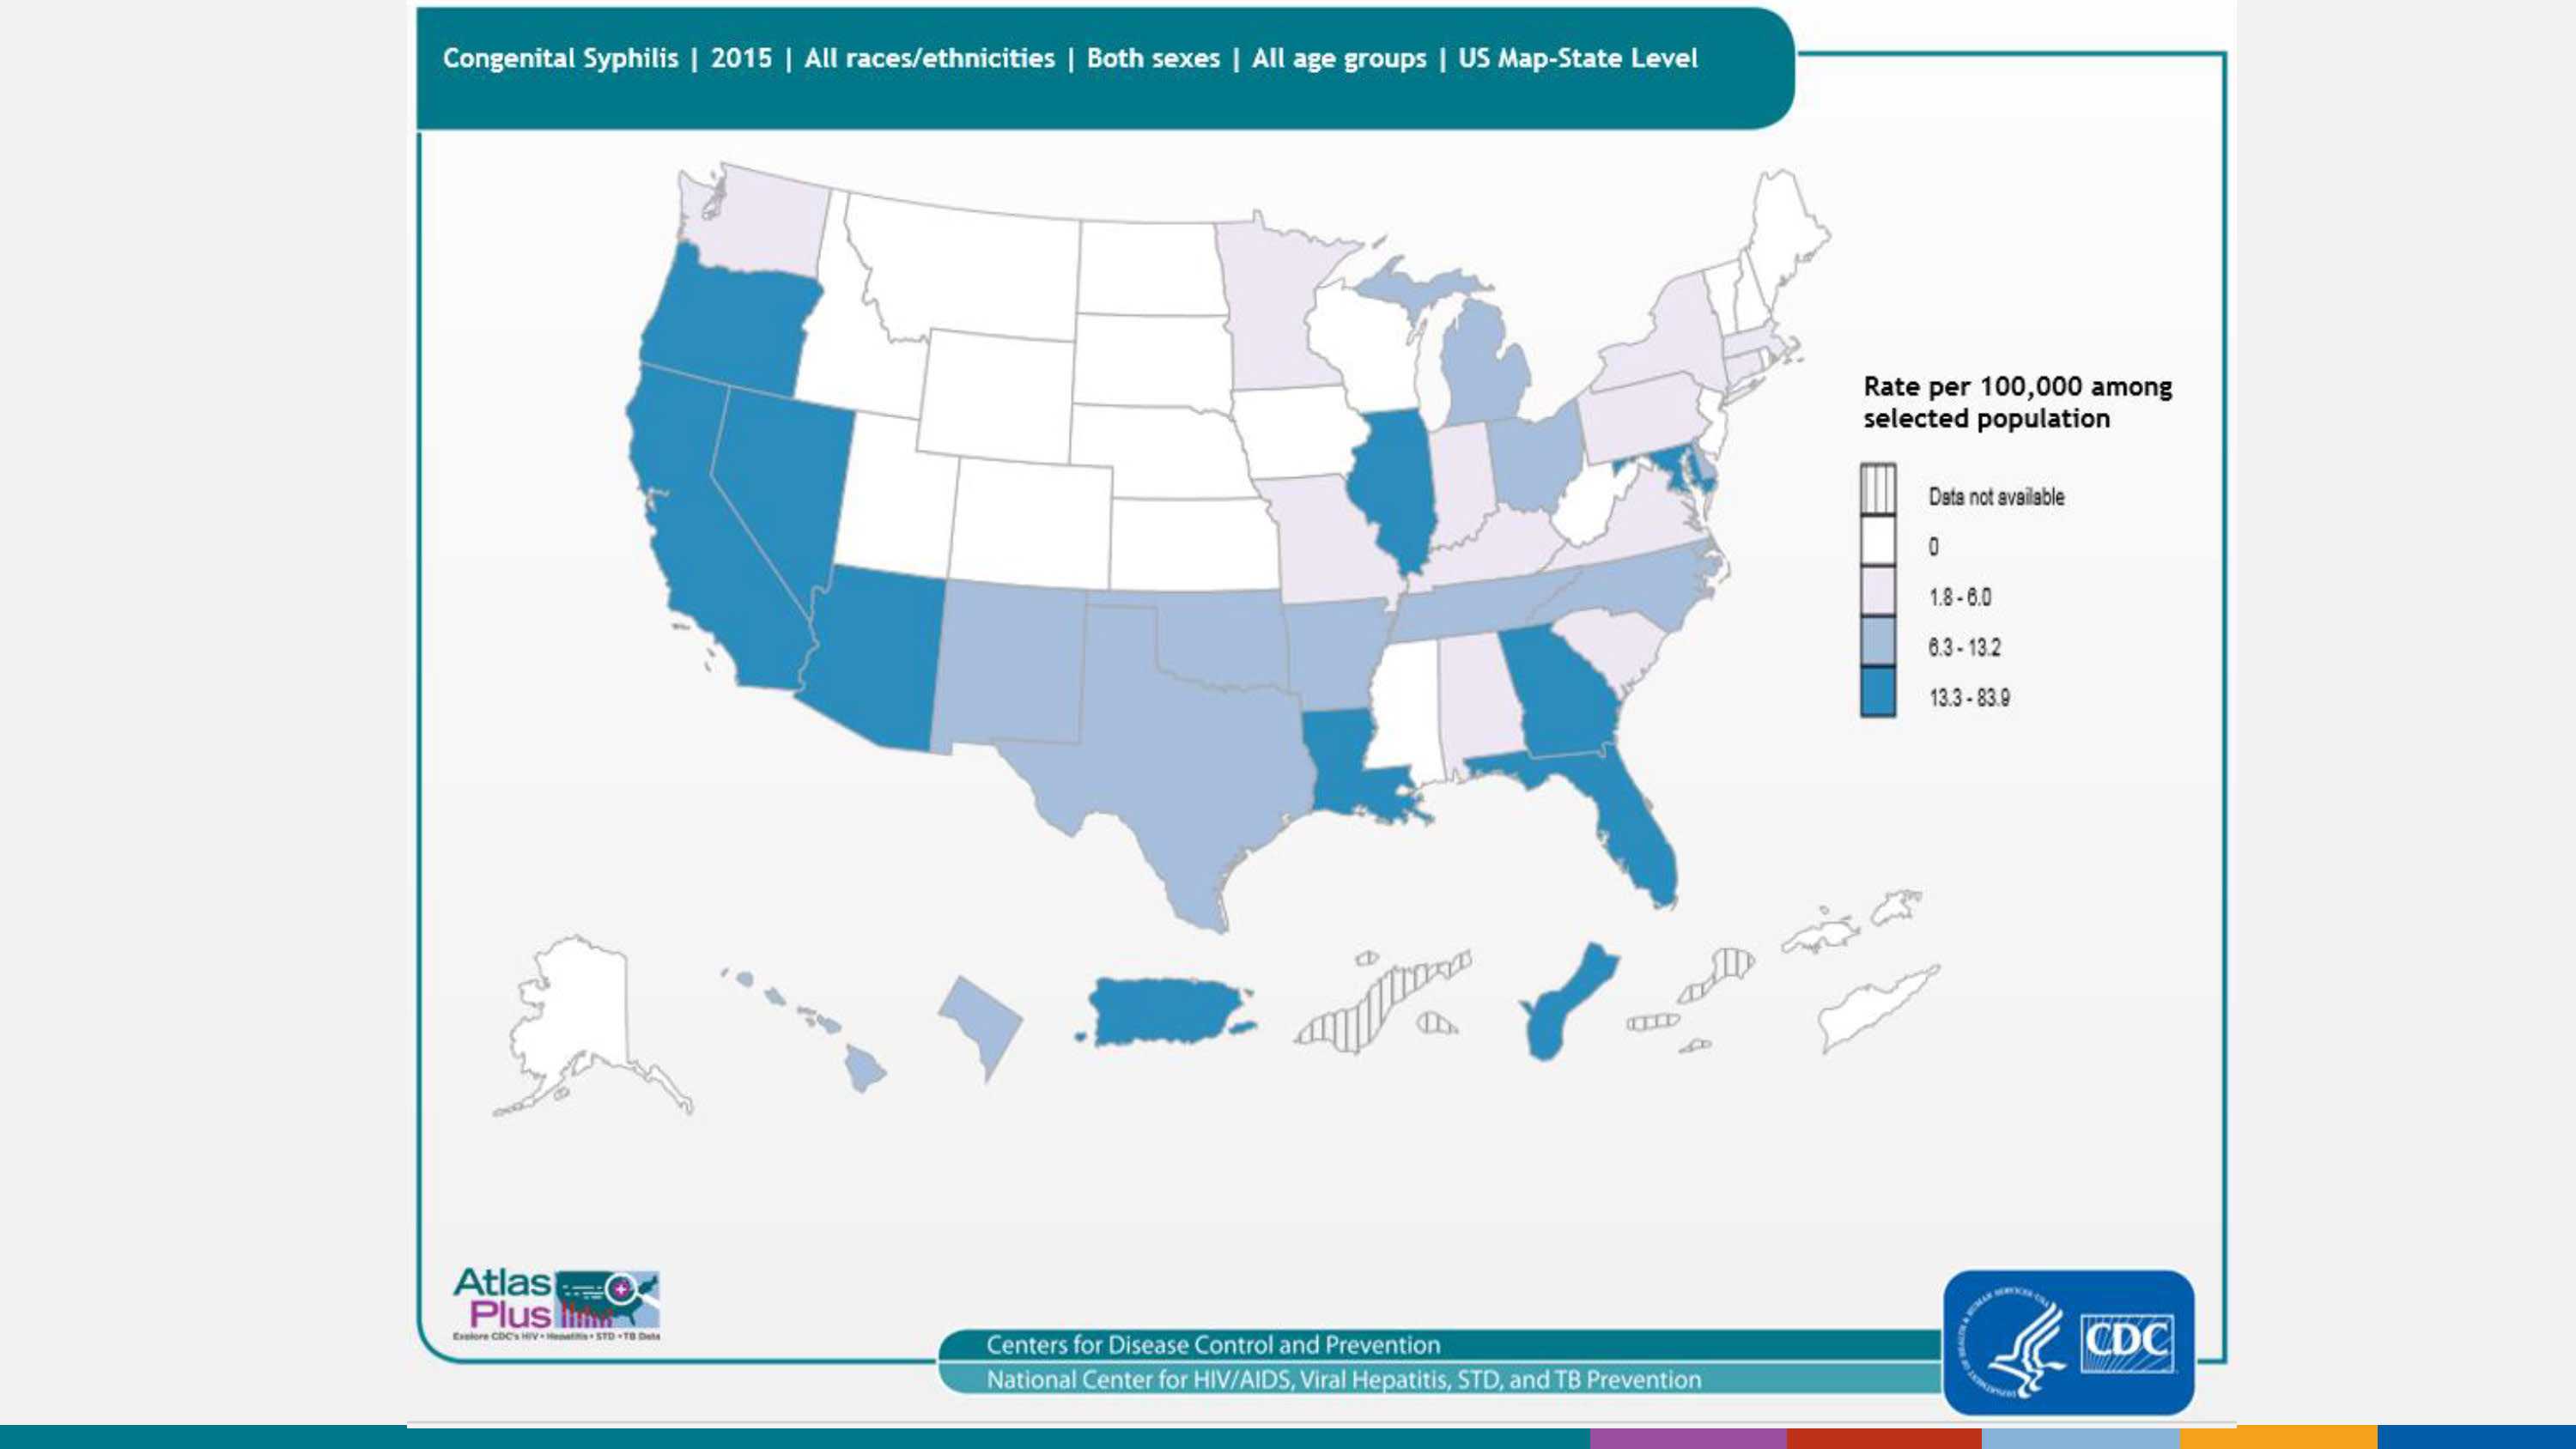
Congenital syphilis cases (2015), 50 states, DC, and outlying areas, by state/area
“Congenital syphilis” is a disease that occurs when a mother with syphilis passes the infection on to her baby during pregnancy. An infected baby may be born without signs or symptoms of congenital syphilis. However, if not treated immediately, the baby may develop serious problems within a few weeks. Untreated babies can have health problems such as cataracts, deafness, or seizures, and can die. As seen in the map, the highest rates of congenital syphilis in 2015 are in the southern US, western US, Illinois, Guam, and Puerto Rico.
For more information: https://www.cdc.gov/std/syphilis/default.htm
Slide 11
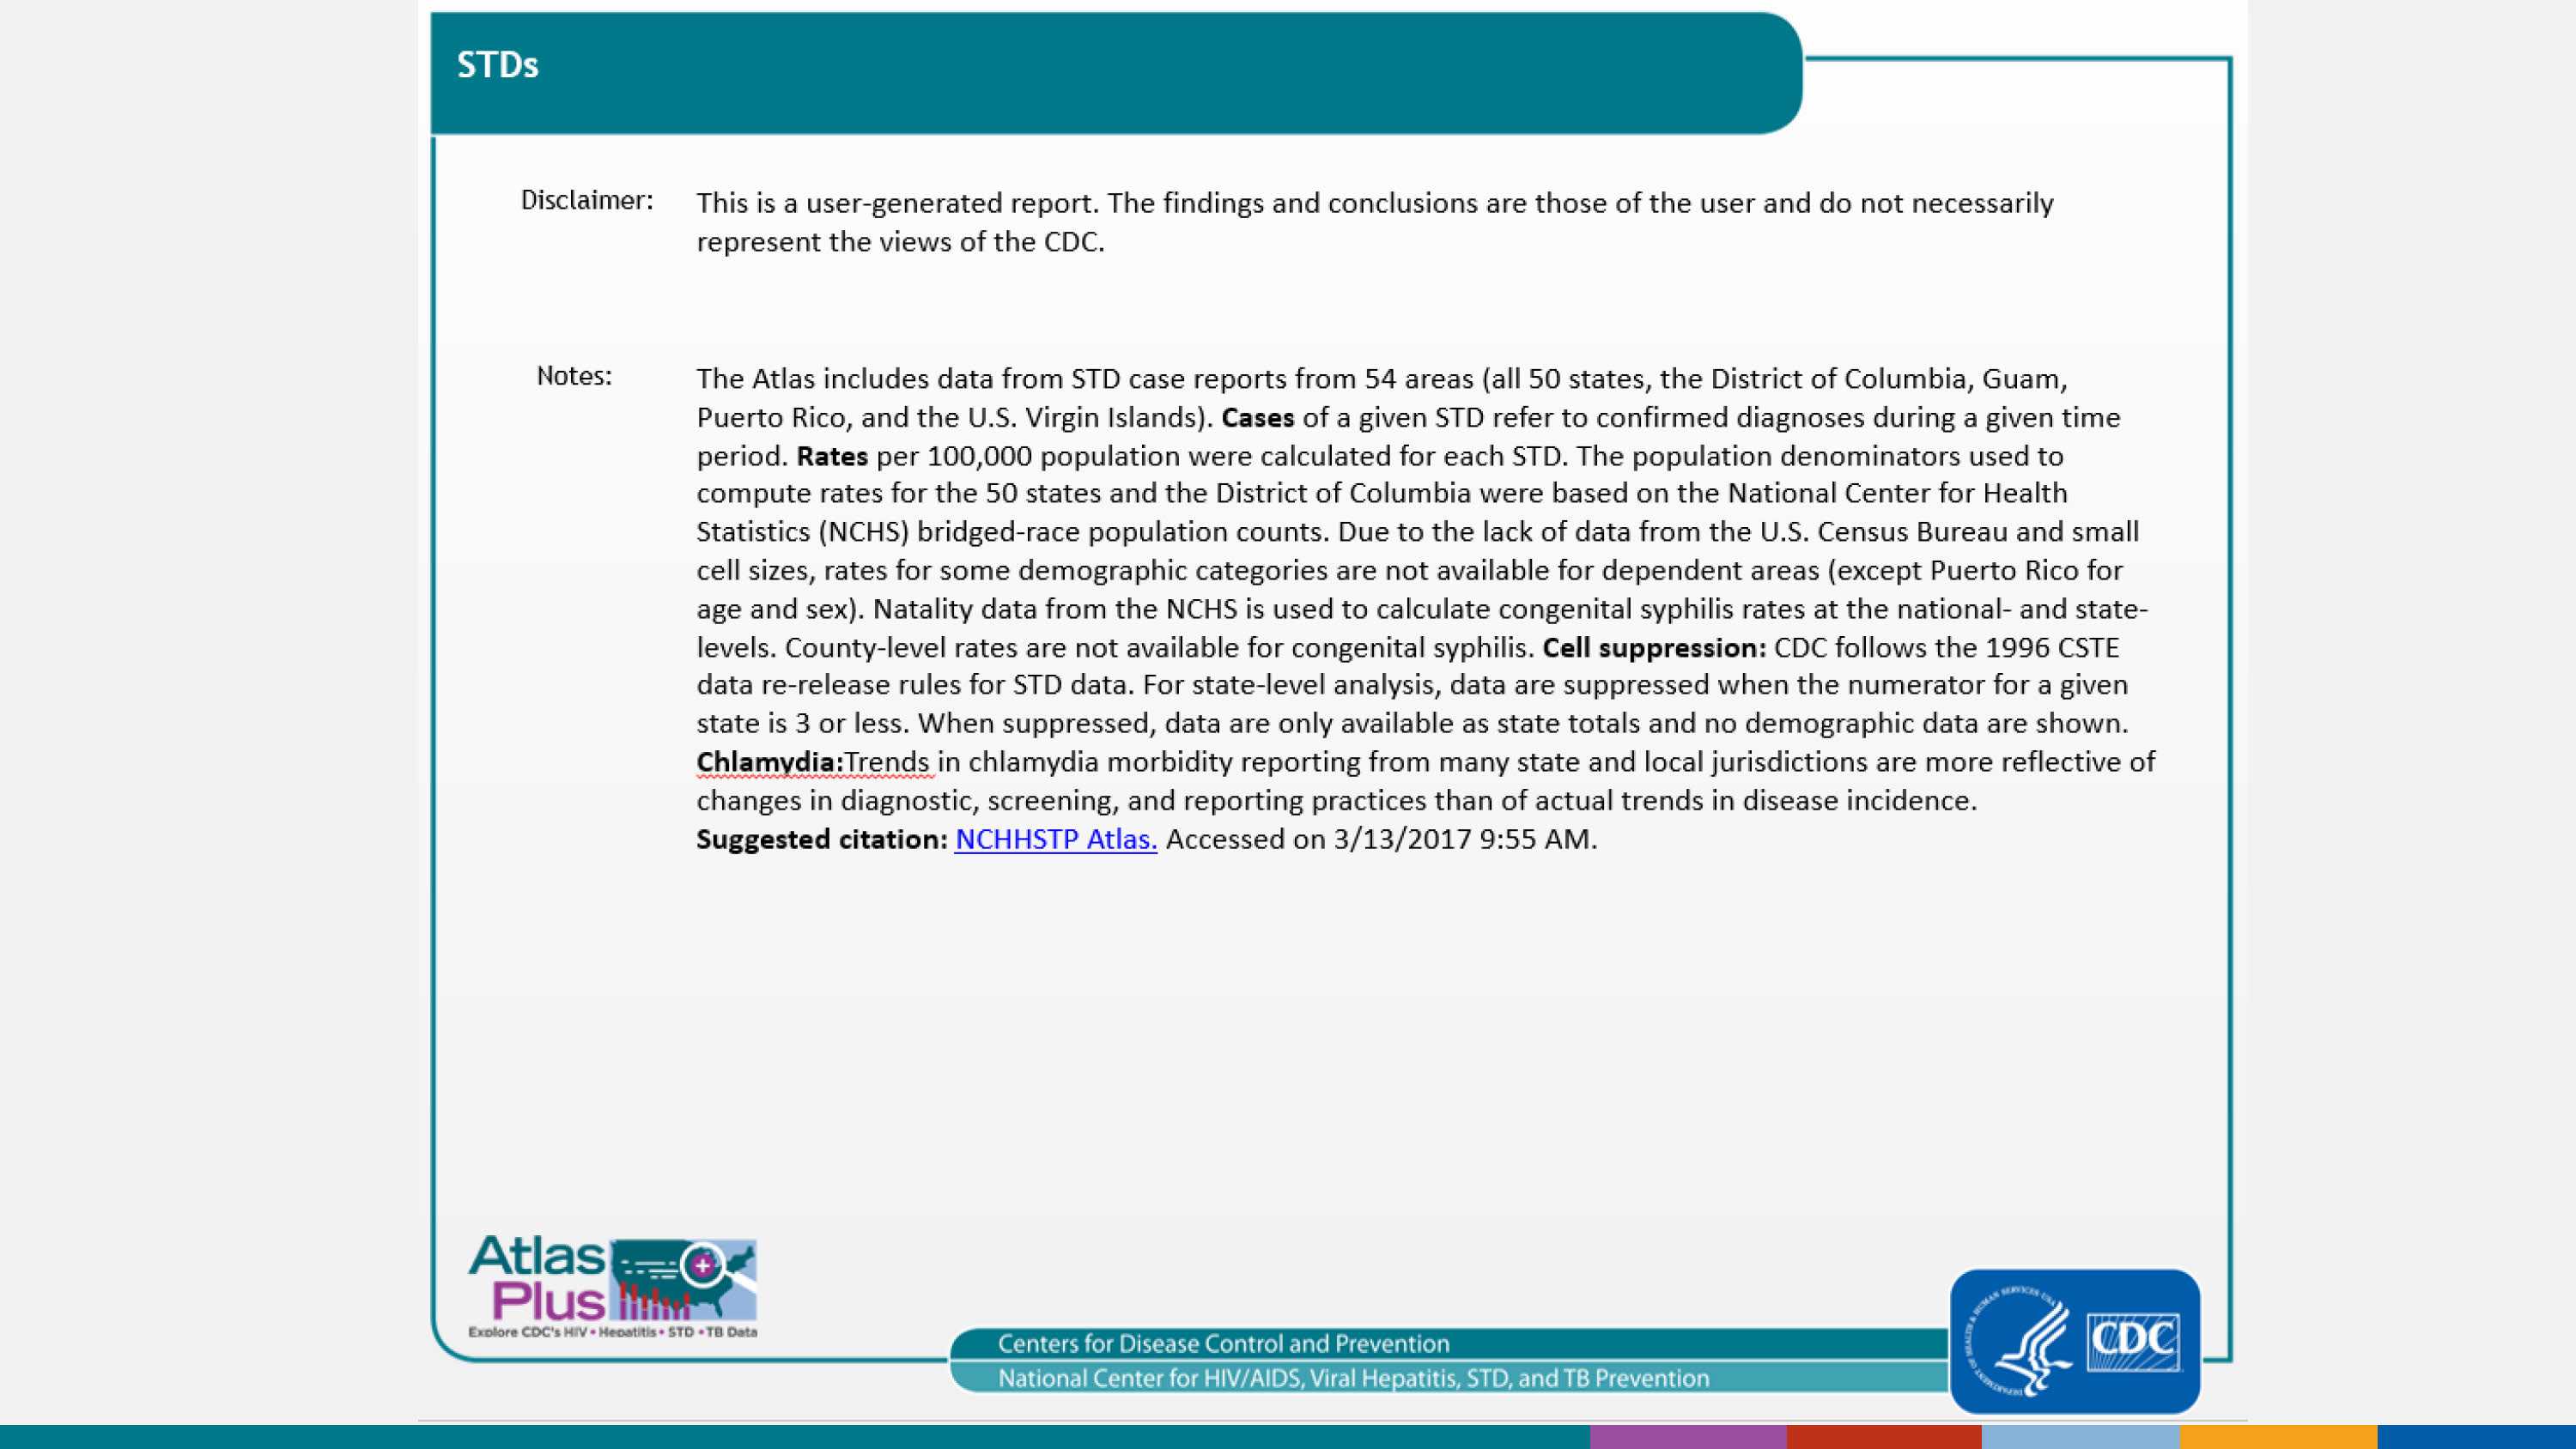
This is a user-generated report. The findings and conclusions are those of the user and do not necessarily represent the views of the CDC.
The Atlas includes data from STD case reports from 54 areas (all 50 states, the District of Columbia, Guam, Puerto Rico, and the U.S. Virgin Islands). Cases of a given STD refer to confirmed diagnoses during a given time period. Rates per 100,000 population were calculated for each STD. The population denominators used to compute rates for the 50 states and the District of Columbia were based on the National Center for Health Statistics (NCHS) bridged-race population counts. Due to the lack of data from the U.S. Census Bureau and small cell sizes, rates for some demographic categories are not available for dependent areas (except Puerto Rico for age and sex). Natality data from the NCHS is used to calculate congenital syphilis rates at the national- and state- levels. County-level rates are not available for congenital syphilis. Cell suppression: CDC follows the 1996 CSTE data re-release rules for STD data. For state-level analysis, data are suppressed when the numerator for a given state is 3 or less. When suppressed, data are only available as state totals and no demographic data are shown. Chlamydia: Trends in chlamydia morbidity reporting from many state and local jurisdictions are more reflective of changes in diagnostic, screening, and reporting practices than of actual trends in disease incidence.
Suggested citation: NCHHSTP Atlas. Accessed
For more information, see: Interpreting STD Surveillance Data.
Slide 12
To learn more about the diseases:
- HIV
- Chlamydia, Gonorrhea, Syphilis
- Acute Viral Hepatitis A, Acute Viral Hepatitis B, and Acute Viral Hepatitis C
- Tuberculosis (TB)
For data sources:
- Page last reviewed: April 6, 2017
- Page last updated: April 6, 2017
- Content source: