

Case Example 4: Transitioning from the WHO Weight-for-Length Chart to the CDC BMI-for-Age Chart at Age 2 Years
 ShareCompartir
Gustavo is a 2-year-6-month old boy who has been followed by his health care provider since he was an infant. His weight and length have been plotted on the WHO weight-for-length chart at each visit. Also, Gustavo's weight has been plotted on the WHO weight-for-age growth chart.1
At 24 months of age, his health care provider changes from the WHO weight-for-length growth chart to the CDC BMI-for-age chart to continue tracking Gustavo's growth. At 24 months of age his weight and length are plotted on the WHO weight-for-length chart and the CDC BMI-for-age chart.
| Date | Age | Wt (lbs) | Length (in) | Stature (in) | BMI-for-age CDC %tile |
|---|---|---|---|---|---|
| 1/21/2010 | 21 months | 22.2 | 31.5 | ||
| 4/19/2010 | 24 months | 24.4 | 33.75 | ||
| 4/19/2010 | 2 years | 24.4 | 33.5 | 15 | |
| 10/19/2010 | 2 years 6 months | 27.0 | 35 | 25 |
1Weight-for-age is important in early infancy for monitoring weight and helping to explain changes in weight-for-length. Weight-for-age is not used to classify infants and children as under or overweight. It reflects body weight relative to age and is influenced by recent changes in health or nutrition status.
| Comparing Weight-for-Length Plotted on the WHO Weight-for-Length Growth Chart and the CDC BMI-for-Age Growth Chart | |
|---|---|
WHO Weight-for-Length Growth Chart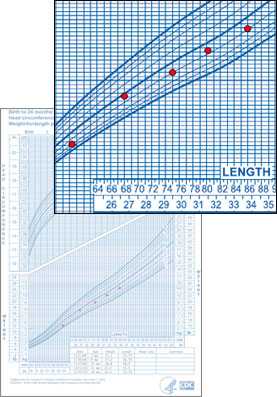 | CDC BMI-for-Age Growth Chart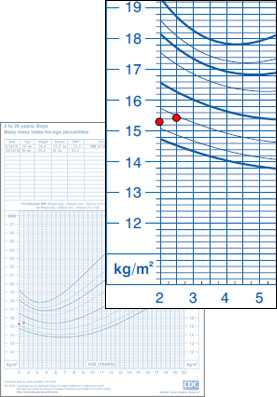 |
Using the WHO Weight-for-Length Growth Chart
At 24 months of age when Gustavo's weight and length are plotted on the WHO weight-for-length growth chart he is between 25th and 50th percentiles. This represents a healthy weight.
Using the CDC BMI-for-Age Growth Chart
At 24 months when his Body Mass Index is plotted on the CDC BMI-for-age chart, his BMI is around the 15th percentile. This represents a healthy weight.
Transitioning from the WHO Weight-for-Length Chart to the CDC BMI-for-Age Chart
When transitioning from the WHO weight-for-length growth chart to the CDC BMI-for-age growth chart at age two years, Gustavo's growth indicators moved from between the 25th and 50th percentile to the 15th percentile. All percentiles represent a healthy weight.
When moving from the WHO weight-for-length chart to the CDC BMI-for-age chart a change in percentile classification may occur. This may be due, in part, to changing from recumbent length to standing height measurements.
Comment: During the transition from the WHO weight-for-length chart to the CDC BMI-for-age chart at age 2 years, caution should be used in interpreting any change in percentiles based on a single measurement. Growth monitoring is based on a series of accurate measurements rather than on a single plot on a growth chart, in this case the CDC BMI-for-age chart, to avoid misinterpretation.
- Page last reviewed: April 15, 2015
- Page last updated: April 15, 2015
- Content source: