

Visual Assessment Versus Calculation of BMI - Example 1: Mike
 ShareCompartir

The first photo is of Mike, a 3-year-old boy. Does he appear to be classified as:
Your visual assessment: Mike is underweight.
Let's assess for overweight or obesity by calculating BMI.
Mike's height is 39.7 inches and his weight is 41.0 pounds.
Enter his BMI here:
BMI Calculator - English
1. Height:
feet
inch(es)
2. Weight:
pounds
(Note: 8 ounces = 0.5 pounds)
Results:
41.0 / 39.7 / 39.7 x 703 = 18.3
That's correct. Mike's BMI=18.3
Now, plot his BMI on the appropriate chart for his age and interpret the findings.
On the boys BMI-for-age chart, find Mike’s age on the horizontal axis, and visually draw a vertical line up from that point. Then, find his BMI on the vertical axis, and visually draw a horizontal line across from that point. The point where the two intersect represents Mike’s BMI-for-age.
His age = 3 years
His BMI = 18.3
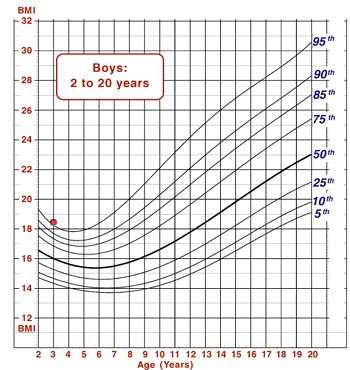
Mike's BMI-for-age falls above the 95th percentile on the BMI-for-age chart for boys so he would be considered obese.
Your visual assessment was that Mike is normal weight.
- Page last reviewed: May 9, 2014
- Page last updated: May 9, 2014
- Content source: