

Visual Assessment Versus Calculation of BMI - Example 3: Lisa
 ShareCompartir
Example 3
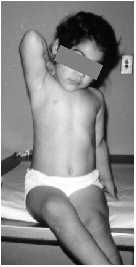
Lisa is another 4 year-old girl. Does she appear to be classified as:
Your visual assessment: Lisa is underweight.
Let's assess for overweight or obesity by calculating BMI.
Lisa's height is 39.2 inches and her weight is 38.6 pounds.
BMI = weight / height / height x 703
Enter her BMI here:
BMI Calculator - English
1. Height:
feet
inch(es)
2. Weight:
pounds
(Note: 8 ounces = 0.5 pounds)
Results:
38.6 / 39.2 / 39.2 x 703 = 17.7
That's right. Lisa's BMI = 17.7
Now, plot her BMI on the appropriate chart for her age and interpret the findings.
On the girls BMI-for-age chart, find Lisa’s age on the horizontal axis, and visually draw a vertical line up from that point. Then, find her BMI on the vertical axis, and visually draw a horizontal line across from that point. The point where the two intersect represents Lisa’s BMI-for-age.
Her age = 4 years
Her BMI = 17.7
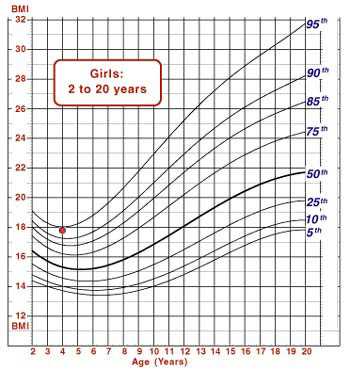
Plotted on the BMI-for-age chart for girls, Lisa's BMI-for-age falls on the 94th percentile so she would be classified as overweight.
Your visual assessment was that Lisa is normal weight.
The point of this exercise is to demonstrate the difficulty of making a consistently accurate visual assessment of healthy weight, overweight or obesity. To make a consistently accurate determination of overweight or obesity, BMI must be determined and plotted on the appropriate growth chart for the appropriate age.
- Page last reviewed: May 9, 2014
- Page last updated: May 9, 2014
- Content source: