The CDC Growth Chart Reference Population
The reference population used to construct the CDC Growth Charts for children aged 2 years to 20 years is a nationally representative sample.
Data Used to Create the Growth Charts
- Child and Adolescent Data in the CDC Growth Chart Reference
Data used to create the growth charts for children and teens aged 2 years to 20 years were nationally representative and obtained from 5 national survey data sets (Kuczmarski et al., 2000).
Data for the CDC Growth Charts included:
- physical measurements of height (also referred to as stature) and weight from children and teens 2 years to 20 years of age.
The measurement data were obtained from a series of national health examination surveys conducted by NCHS from 1963 to 1994. These surveys and data sources included:
- National Health Examination Survey (NHES), Cycle II (1963-65; ages 6-11y)
- National Health Examination Survey (NHES), Cycle III (1966-70; ages 12-17y)
- National Health and Nutrition Examination Survey (NHANES) I (1971-74; ages 2-19 y)
- National Health and Nutrition Examination Survey (NHANES) II (1976-80; ages 2-19 y)
- National Health and Nutrition Examination Survey (NHANES) III (1988-94; ages 2-19 y for stature, ages 2-5 y for weight and BMI)
In each of the cross-sectional surveys, a national probability sample of the civilian, non-institutionalized population of the United States was examined. Survey-specific sample weights were applied to the national survey sample data to assure representation of the U.S. population according to age, sex, and racial/ethnic composition at the time the surveys were conducted.
Exclusions from the Growth Reference Population
- NHANES III Weight Data for Children Aged 6 Years and Older
These data were excluded to avoid the upward shift in the weight-for-age and BMI-for-age curves given the secular change in body weight that occurred in the 1980s and 1990s (Kuczmarski et al., 2002).
Read More about...
Race/Ethnicity of the Reference Population
The racial and ethnic distribution in the reference population is representative of the U.S. population at the time each of the NHES and NHANES surveys were conducted.
CDC promotes one set of growth charts for all racial and ethnic groups. Racial- and ethnic-specific charts are not recommended because studies support the premise that differences in growth among various racial and ethnic groups are the result of environmental rather than genetic influences (Garza and de Onis, 2004; Lusky, 2000; Mei, Yip, Trowbridge, 1998; Kuczmarski et al 2002).

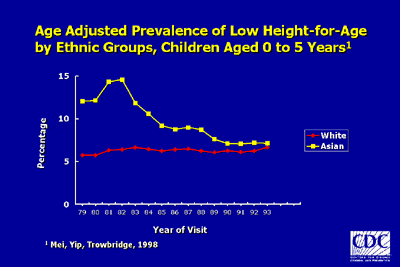
For example, this graph shows data from the Pediatric Nutrition Surveillance System on the prevalence of low height-for-age or stunting of recently immigrated refugee children from Southeast Asia in the early 1980s (yellow line) compared to white children (red line). By the 1990s, the prevalence of low height-for-age had declined among Asian children and heights for age were almost identical to that of white children in the United States. This study illustrates the effect of environmental factors on growth. Improved socioeconomic status often is associated with improved growth (Mei, Yip, Trowbridge, 1998).
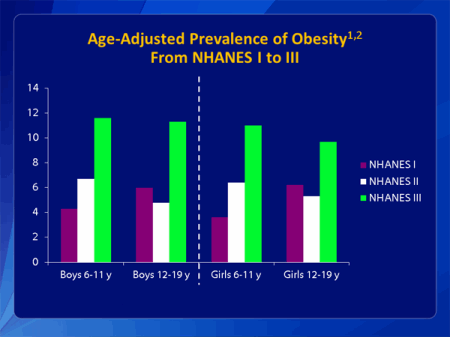
Prevalence of Obesity in NHANES III

1 ≥95th percentile BMI-for-age.
2 http://www.cdc.gov/nchs/data/hestat/obesity_child_09_10/obesity_child_09_10.htm
There was a significant increase in the prevalence of obesity in the NHANES III (green bar) for boys and girls ages 6 to 11 and 12 to 19 when compared to NHANES I (purple bar) and II (white bar). If data from NHANES III had been included, the resulting 95th percentile curve would have been higher, thus classifying fewer children and teens as obese.
- Page last reviewed: March 10, 2016
- Page last updated: March 10, 2016
- Content source:


 ShareCompartir