Using BMI-for-age as a Screening Tool
Advantages to Using BMI-For-Age As a Screening Tool for Obesity, Overweight, and Underweight
There are several advantages to using BMI-for-age to screen for obesity, overweight, and underweight among children and teens.
BMI-for-age is the only indicator that allows us to plot a measure of weight and height, also referred to as stature, with age on the same chart. The BMI-for-age percentile ranking indicates the relative position of the child’s BMI number among children of the same sex and age from the reference population. Age and stage of sexual maturity are associated with body fatness (Kaplowitz, 2008; Wang 2002; Daniels et al., 1997).
BMI-for-age is the measure that can be used continuously from age 2 to 20 years to screen for obesity, overweight, or underweight.
BMI-for-age is not recommended for use in the United States before 2 years of age to screen for overweight, obesity, or underweight. For children younger than 2 years of age, BMI normative values are not available in the United States (Barlow, 2007), and BMI values at young ages have a weak association with adolescent or adult obesity (Whitaker et al., 1997; Guo et al., 1994).
For children younger than 2 years old, the CDC recommends using the WHO growth charts to monitor growth (Grummer-Strawn, 2010). Plot weight-for-length values over time to monitor growth, and screen for high or low weight relative to length (Barlow, 2007).
BMI can be used to track body size throughout the life cycle. (Among children and teens, BMI for age and sex is used, and among adults, BMI is used). This is important because BMI-for-age in childhood is a determinant of adulthood BMI (Freedman and Sherry, 2009).
Read More About...
Tracking BMI-for-Age from Childhood and Adolescence to BMI in Adulthood
Tracking BMI-for-Age from Childhood and Adolescence to BMI in Adulthood

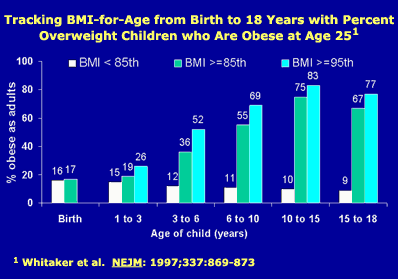
The tracking of BMI that occurs from childhood to adulthood is clearly shown in data from a study by Robert Whitaker and colleagues (Whitaker et al., 1997), who examined the probability of obesity among young adults in relation to the presence or absence of overweight at various times during childhood. For this study, childhood obesity was defined as a BMI at or above the 85th percentile for age and sex, and adult obesity as a mean BMI at or above 27.8 for men and 27.3 for women. For example, among children 10 to 15 years old, 10% of those with a BMI-for-age less than the 85th percentile were obese at age 25, whereas 75% of those with a BMI-for-age greater than or equal to the 85th percentile were obese as adults, and 80% of those with a BMI-for-age greater than or equal to the 95th percentile were obese at age 25. (The sample size for the study was 854.) From this study, it is clear that an overweight child is more likely than a child with a healthy weight to be obese as an adult.
Other studies have also shown that children with high BMI measurements are more likely to become obese adults than are thinner children (Deshmukh-Taskar et al., 2006; Harris et al., 2006; Guo et al., 1999;).
- BMI-for-age relates to health risks.
BMI-for-age correlates with clinical risk factors for cardiovascular disease, including high cholesterol and high blood pressure (Reilly et al. 2003). Freedman and colleagues used data from the Bogalusa Heart Study and found that approximately 70% of children who were obese had at least one risk factor for cardiovascular disease, and 39% had two or more risk factors (Freedman et al., 2007).
- BMI-for-age during pubescence is related to lipoprotein levels and blood pressure in middle age (Berenson GS, 1998; Must et al., 1992).
- Page last reviewed: May 9, 2014
- Page last updated: May 9, 2014
- Content source:


 ShareCompartir