

Widgets
 ShareCompartir
2016 Annual Summary
Launch Date: November 2008
CDC.gov Widgets traffic has grown 26% in 2016 over the prior year. A “view” includes the number of times a widget was loaded on a page, while an “interaction” can include the number of times the “go” button was clicked, the “previous” and “next buttons” were clicked, or the number of times the user browsed through the contents of a widget and interacted with a component of the widget. “Instances” are a measure of views and interactions combined. The number of sites where a widget was embedded can also be called “virality.” This refers to the widget being spread by users sharing it and adding it on their own sites, bringing new users to the original CDC content and therefore adding additional utility.
Total Widget Instances 2016 |
|
|---|---|
| Month | Instances |
| 1 | 474,382 |
| 2 | 487,918 |
| 3 | 528,130 |
| 4 | 405,170 |
| 5 | 331,815 |
| 6 | 273,674 |
| 7 | 395,919 |
| 8 | 594,027 |
| 9 | 596,041 |
| 10 | 620,308 |
| 11 | 770,596 |
| 12 | 815,071 |
| TOTAL | 6,293,051 |
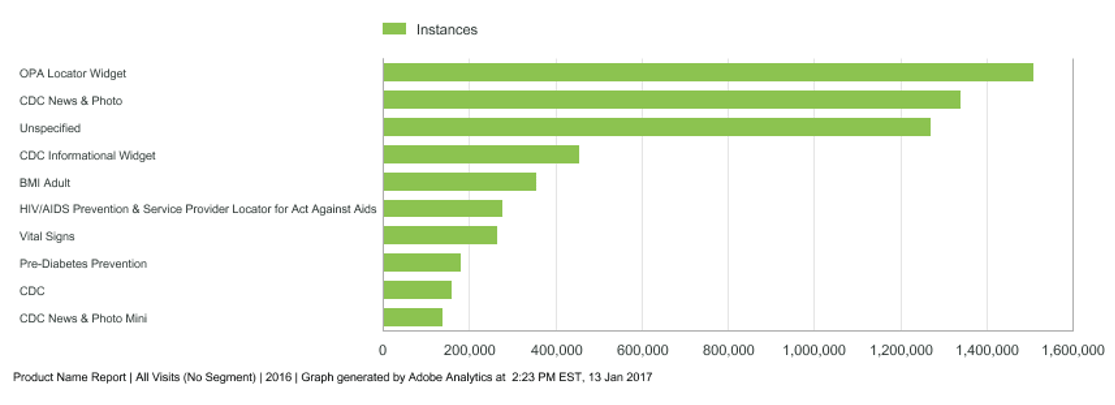
Ten Most Popular Widgets 2016 |
||
|---|---|---|
| Rank | Widget Name | Instances |
| 1 | OPA Locator Widget | 1,508,380 |
| 2 | CDC News & Photo | 1,338,988 |
| 3 | Unspecified | 1,270,060 |
| 4 | CDC Informational Widget | 455,875 |
| 5 | BMI Adult | 356,145 |
| 6 | HIV/AIDS Prevention & Service Provider Locator for Act Against Aids | 279,046 |
| 7 | Vital Signs | 266,563 |
| 8 | Pre-Diabetes Prevention | 182,494 |
| 9 | CDC | 159,911 |
| 10 | CDC News & Photo Mini | 139,983 |
- Page last reviewed: January 14, 2016
- Page last updated: February 7, 2017
- Content source:
- Centers for Disease Control and Prevention
- Page maintained by: Office of the Associate Director for Communication, Division of Public Affairs