

CDC Mobile
 ShareCompartir
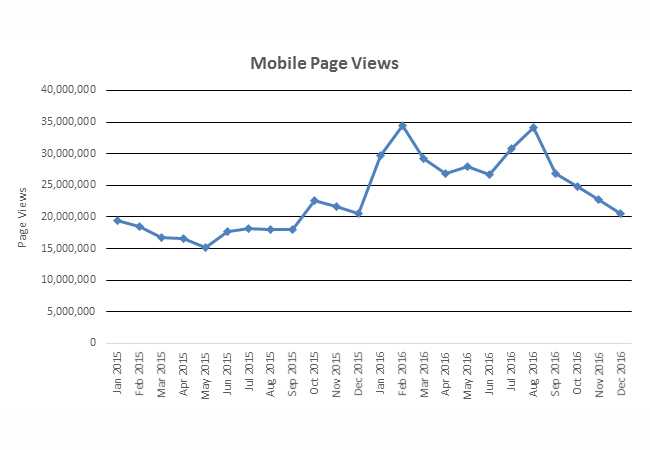
Traffic to the Website from Mobile Devices
Traffic to the website from mobile devices increased overall in the last two years. In 2016 mobile views were up 50% from 2015 growing from 223 million page views in 2015 to 335 million page views in 2016. The spike and continued high level of page views in February 2016 is due to a high interest in Zika outbreak content.
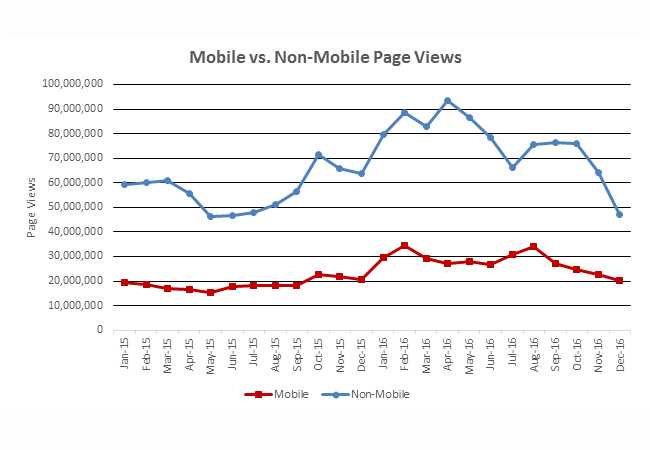
Over the past two years, traffic from non-mobile devices decreased while traffic from mobile devices increased.
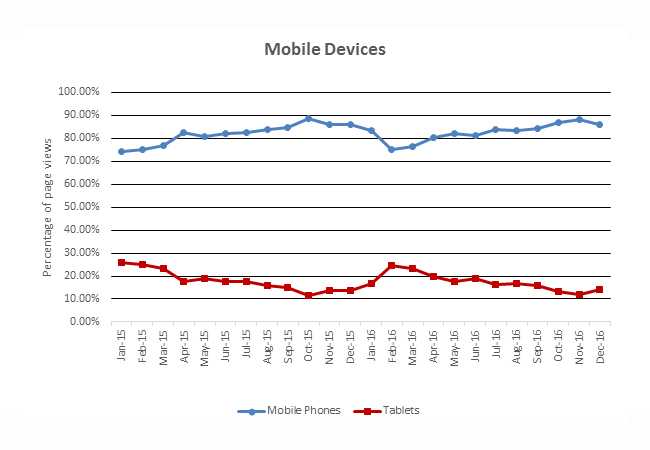
The two main contributors to mobile views to the website continues to be mobile phones and tablets. In 2015 traffic from mobile phones averaged over 80% of the traffic from mobile devices and traffic from tablets averaged almost 18%. In 2016 these averages remained within one percent of the previous year.
|
2016 Top 10 Channels for Mobile Devices |
|||||
|---|---|---|---|---|---|
| Mobile Phone s | Tablet s | ||||
| Rank | Channel Name | Page Views | Rank | Channel Name | Page Views |
| 1 | STD | 40,444,967 | 1 | Zika virus | 5,274,338 |
| 2 | Zika virus | 33,276,981 | 2 | Travelers’ Health | 3,652,397 |
| 3 | Seasonal Flu | 15,261,240 | 3 | STD | 3,217,851 |
| 4 | Travelers’ Health | 13,905,334 | 4 | Seasonal Flu | 2,469,457 |
| 5 | Vaccines | 11,580,388 | 5 | CDC Top Tier | 1,981,641 |
| 6 | CDC Top Tier | 10,924,835 | 6 | Vaccines | 1,965,765 |
| 7 | NCBDDD | 9,669,759 | 7 | NCBDDD | 1,665,193 |
| 8 | CDC Spanish | 6,794,361 | 8 | Parasites | 1,513,536 |
| 9 | HFMD | 6,644,810 | 9 | NCHS | 934,263 |
| 10 | Parasites | 6,415,809 | 10 | Search Results | 922,104 |
- Page last reviewed: February 1, 2017
- Page last updated: February 1, 2017
- Content source:
- Centers for Disease Control and Prevention
- Page maintained by: Office of the Associate Director for Communication, Division of Public Affairs