

CDC.gov Satisfaction Scores
 ShareCompartir
2016 Satisfaction Report
Background:
The American Customer Satisfaction Index (ACSI) provides an independent measure of user satisfaction. The ACSI’s time-tested, scientific model provides key insights across the entire CDC.gov web experience.
Summary:
The following report includes satisfaction data from users who responded to CDC.gov’s desktop and mobile surveys between January 1, 2016, and December 31, 2016. Users took different surveys based on how they visited the CDC website – either on desktop or on a mobile device.
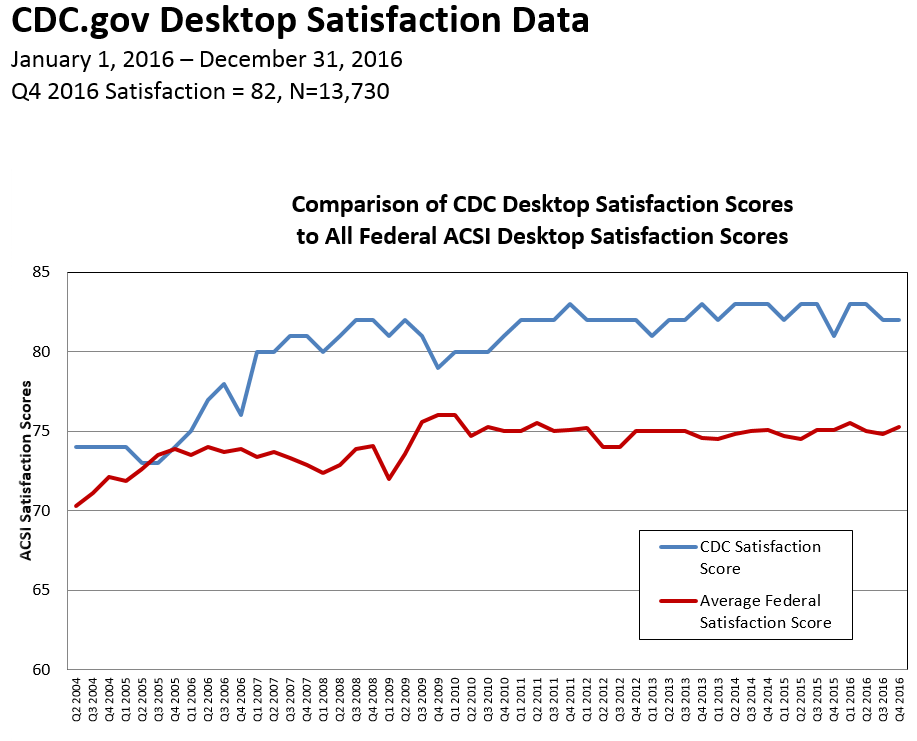
Desktop Satisfaction Overview
During the 2016 calendar year, CDC’s desktop site received an overall satisfaction rating of 82 (on a scale of 100). As such, CDC is classified as a “top performer” by the American Customer Satisfaction Index. In Q4 of 2016:
- CDC.gov received a satisfaction score of an 82, while the average for Federal websites was 75.3.
- CDC.gov was ranked 1st in customer satisfaction for all Federal Portals/Department Main Sites.
- Full Foresee E-Government Q4 2016 report
Mobile Satisfaction Overview
During the 2016 calendar year, CDC’s mobile site received a satisfaction rating of 82 (on a scale of 100). The American Customer Satisfaction Index considers a score of 80 or higher as “Excellent.” The average for Federal websites in Q4 2016 was 77.8.
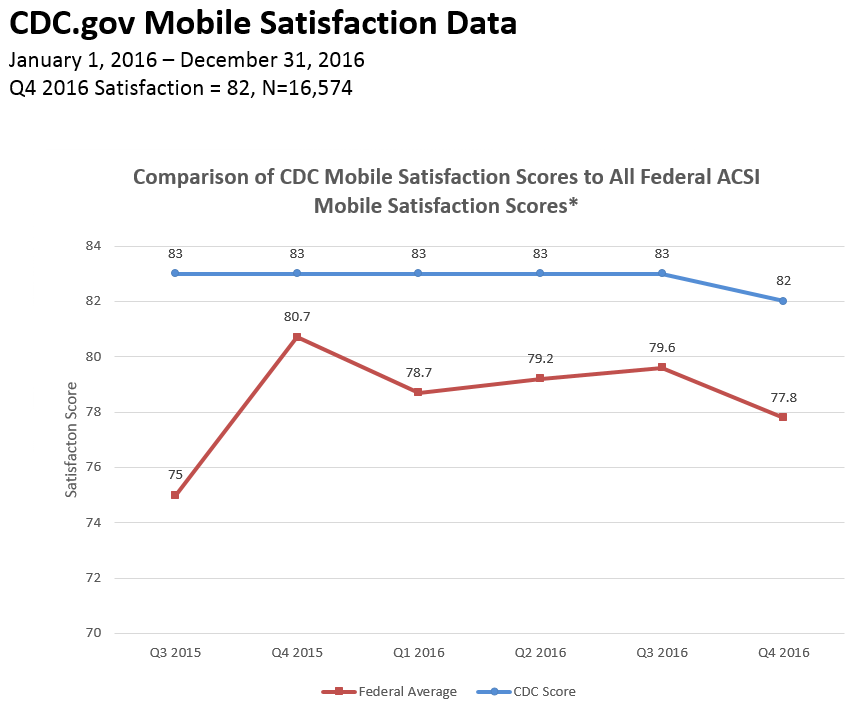
*CDC’s mobile survey went live at the end of Q3 2015. Therefore, this graph compares CDC’s performance against the average federal mobile site from that point until the most recent quarter.
Snapshot of Key Demographics
Desktop
Jan 1, 2016 – Dec 31, 2016
N=18,026
From January 1,2016 – December 31, 2016, 23,886 users were presented with the ACSI Survey. Of those presented, 13,744 (57.5%) took the survey.
Role
- Healthcare Providers: 25%
- Individuals Interested in Healthi: 18%
- Educators: 11%
- Students: 10%
- Traveler: 9%
- Public Health Professional: 9%
- Scientist or Researcher: 7%
- Other: 7%
Users were primarily looking for:
- Diseases and Conditions: 41%
- Other: 12%
- Traveler’s Health: 11%
Successfully find what they are looking for: 91% (yes 69%, partially 22%)
Frequent users: 48% (Monthly 22%, Weekly 21%, Daily 5%)
New users: 22% (“This is my first time using the CDC.gov site”)
Middle-aged, 35 – 64: 64%
College degree: 80% (College Degree 32%, Advanced Degree 48%)
Gender
- Female: 60%
- Male: 36%
- Prefer not to answer: 4%
Mobile
Jan 1, 2016 – Dec 31, 2016
N=16,574
From January 1,2016 – December 31, 2016, 51,293 users were presented with the ACSI Survey. Of those presented, 16,574 (32.3%) took the survey.
Role
- Individuals Interested in Healthi: 42%
- Healthcare Providers: 18%
- Traveler: 12%
- Other: 9%
- Student: 7%
- Educator: 4%
- Public health professional: 3%
- Scientist or researcher: 3%
Users were primarily looking for:
- Diseases and Conditions: 41%
- Traveler’s Health: 12%
- Other: 11%
Successfully find what they are looking for: 86% (yes 65%, partially 21%)
Frequent users: 36% (Monthly 17%, Weekly 14%, Daily 5%)
New users: 35% (“This is my first time using the CDC.gov site”)
Middle-aged, 35 – 64: 61%
College degree: 66% (College Degree 31%, Advanced Degree 35%)
Gender
- Female: 66%
- Male: 30%
- Prefer not to answer: 4%
____________________
i Note that mobile use by individuals interested in health is almost double on mobile compared to desktop.
- Page last reviewed: April 20, 2016
- Page last updated: February 28, 2017
- Content Source:
- Centers for Disease Control and Prevention
- Page maintained by: Office of the Associate Director for Communication, Division of Public Affairs