CDC.gov Traffic
2016 Annual Summary
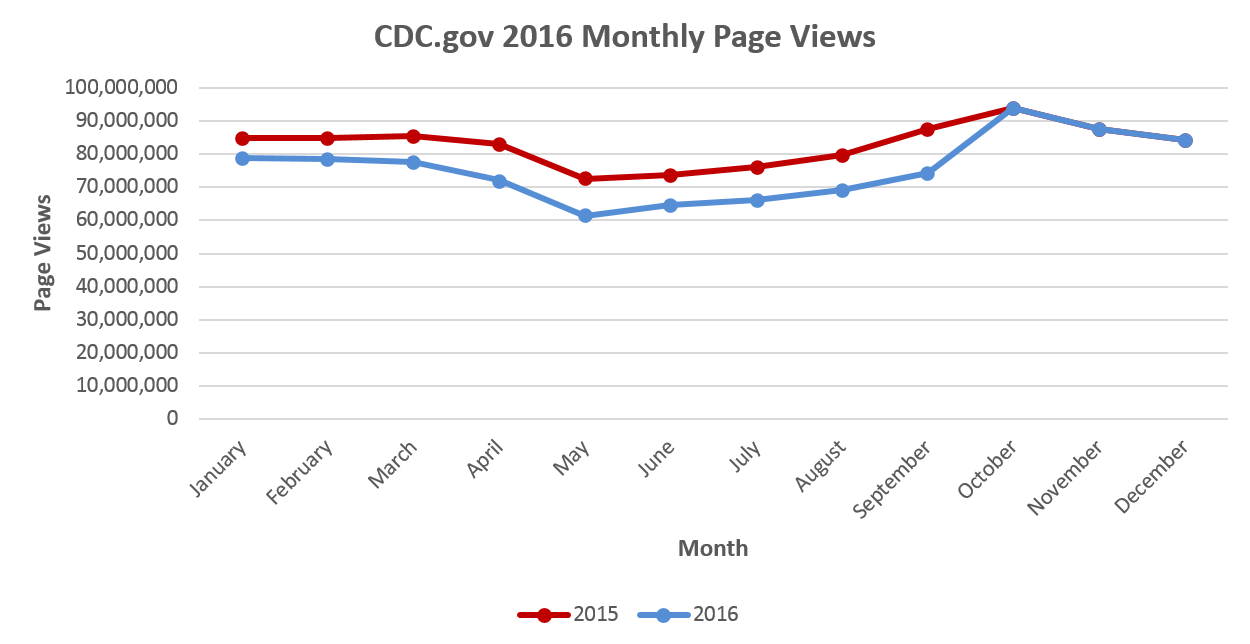
In 2016, page view traffic decreased 8.5% from the prior year to approximately 908 million page views. Interest in Zika topics contributed to the rise in traffic between May and October 2016.

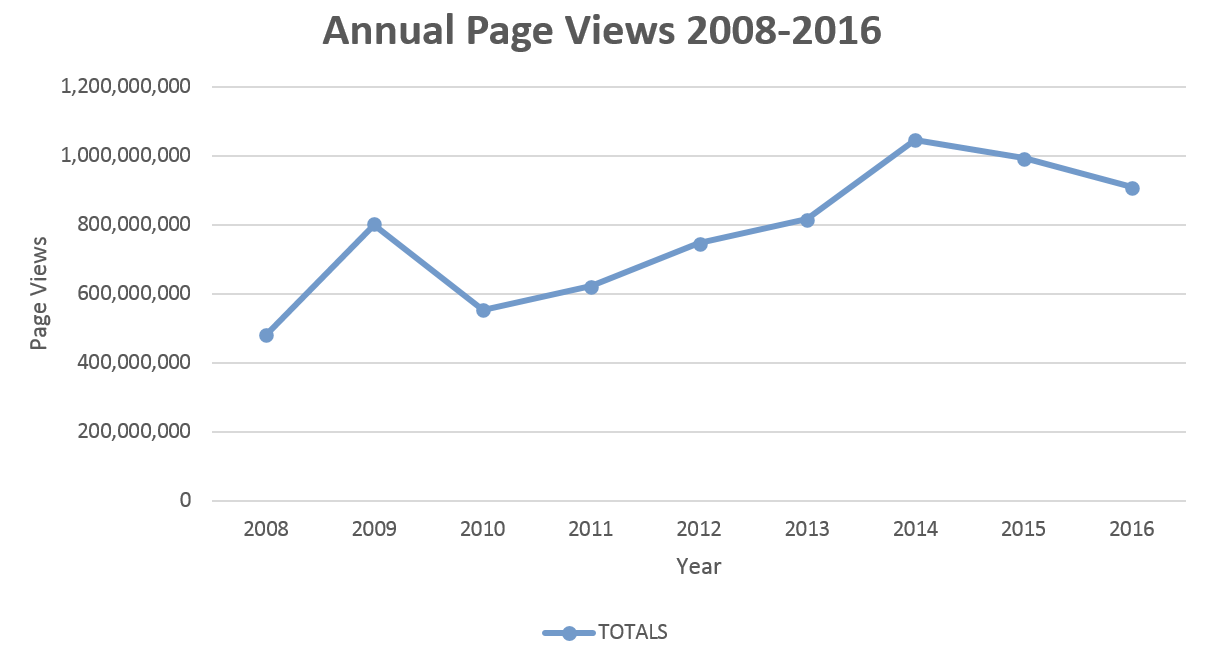
Page views to CDC.gov has steadily risen from 2008-2016, showing a spike in 2009 due to CDC Flu and H1N1 content. Ebola generated the greatest interest in 2014 at over 54 million page views. While 2016 continues a downward trend, overall page views are higher than 2013.

- Page last reviewed: January 13, 2016
- Page last updated: February 7, 2017
- Content source:
- Centers for Disease Control and Prevention
- Page maintained by: Office of the Associate Director for Communication, Division of Public Affairs


 ShareCompartir